Author Affiliations
1 Institute of Geographical Spatial Information, Information Engineering University, Zhengzhou, Henan 450001, China2 State Key Laboratory of Geo-Information Engineering, Xi'an, Shaanxi 710054, China3 Institute of Data and Target Engineering, Information Engineering University, Zhengzhou, Henan 450001, Chinashow less
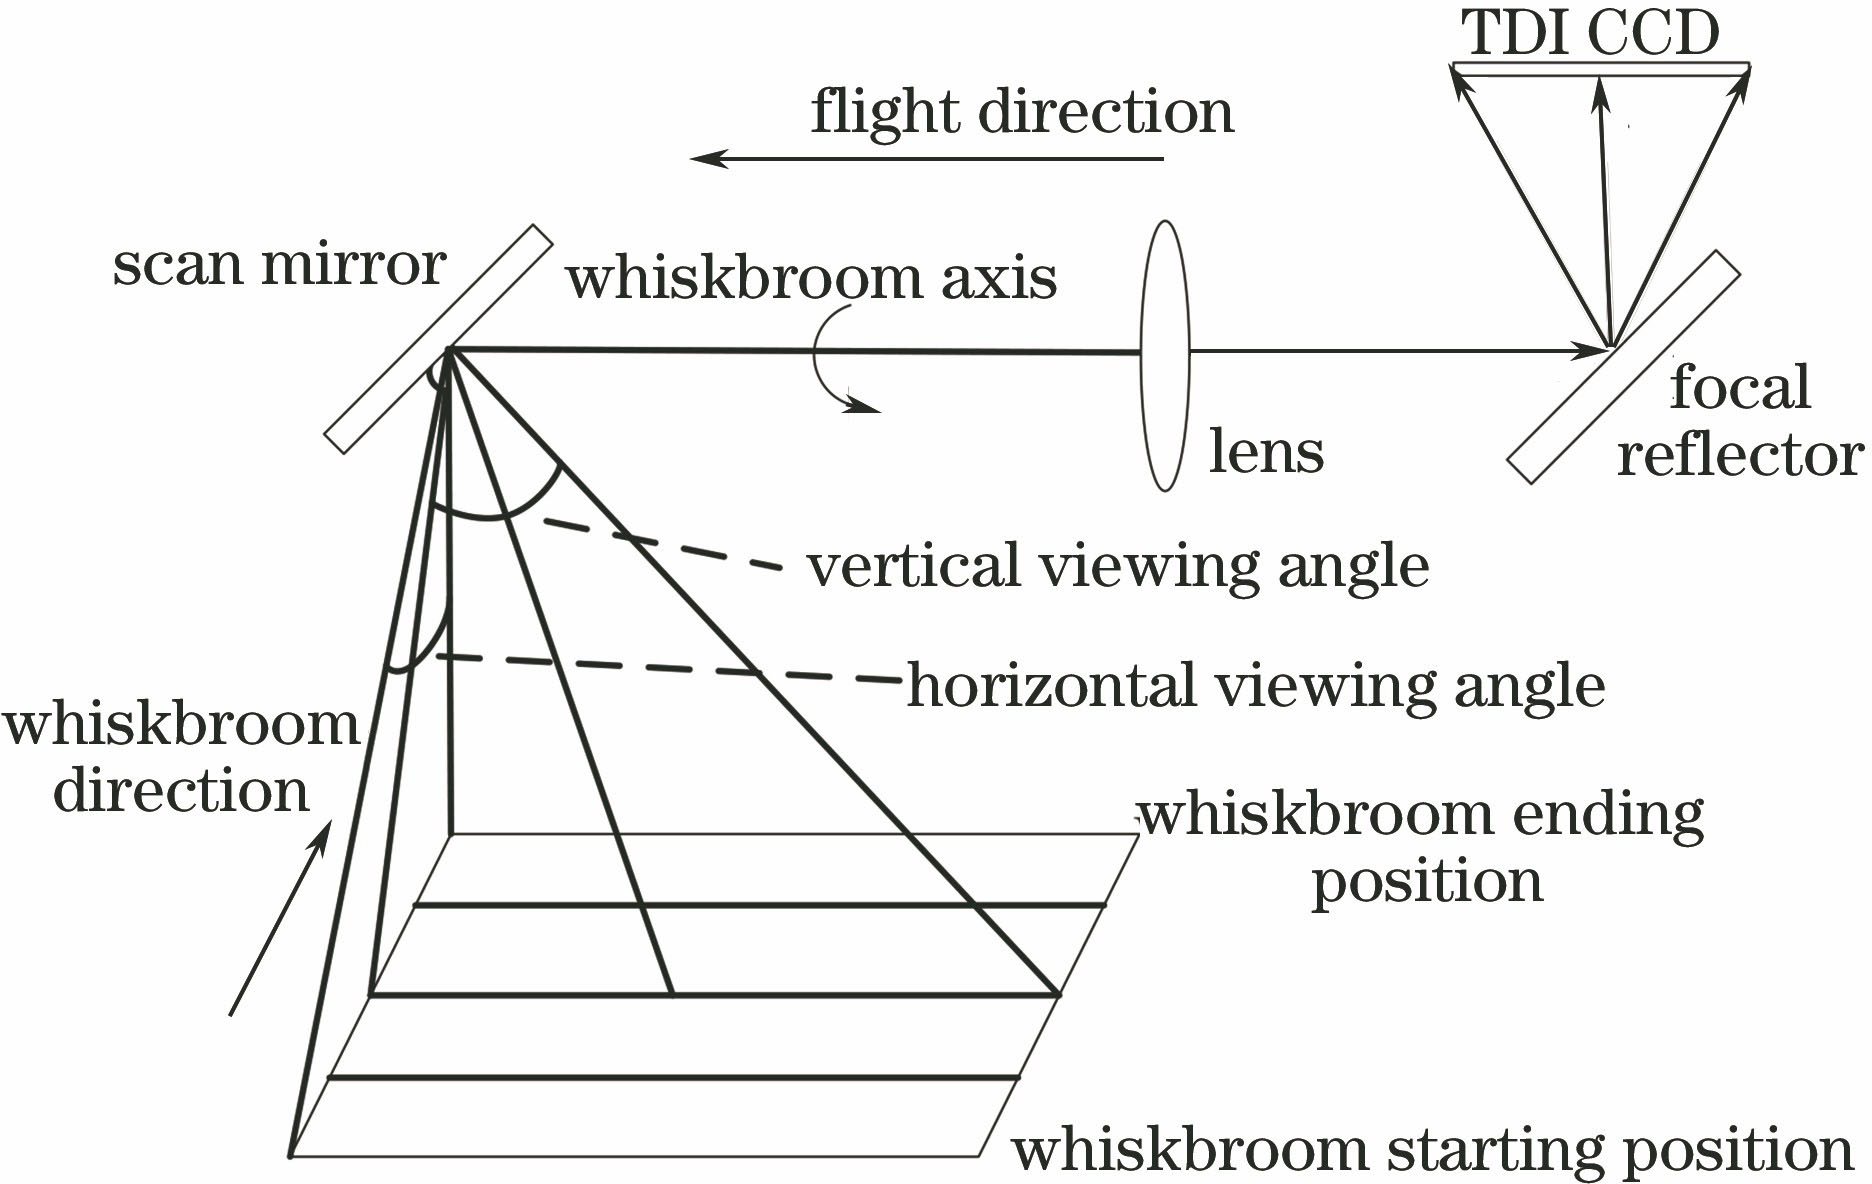
Fig. 1. Schematic of linear whiskbroom camera imaging
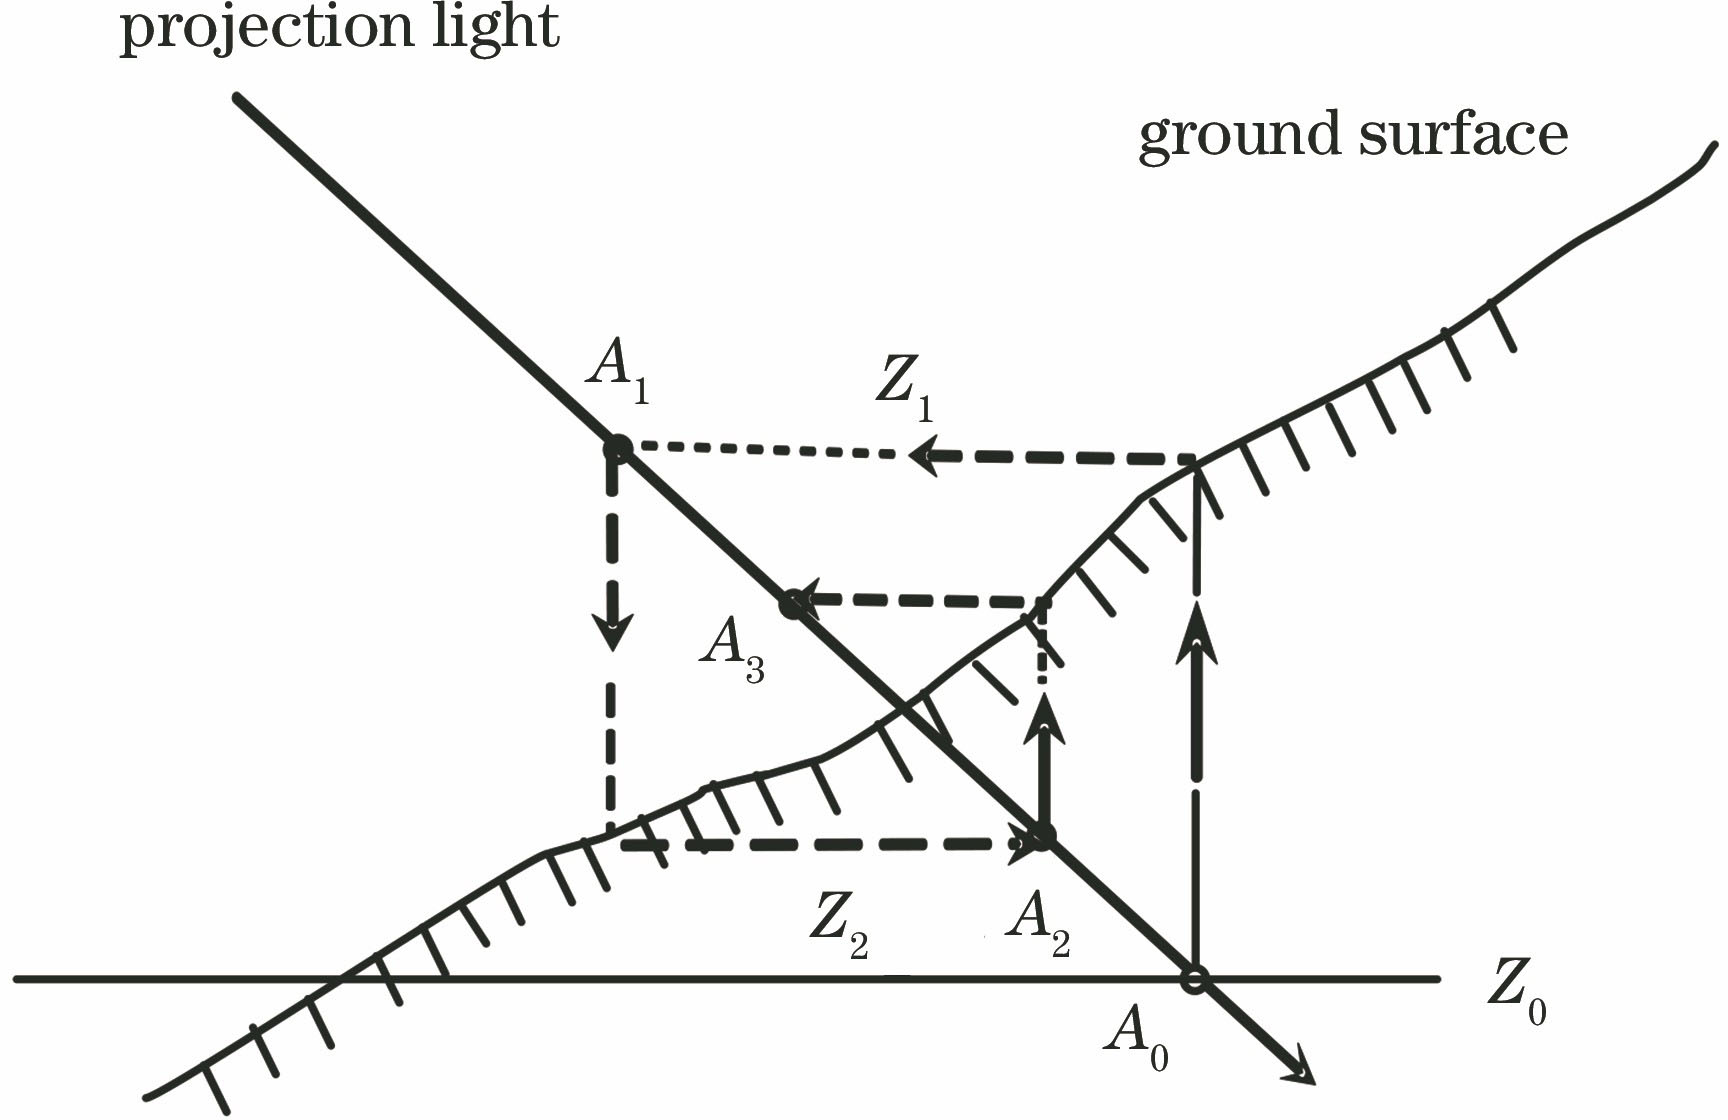
Fig. 2. Calculation process of iteration photogrammetry method
Fig. 3. Situation of iterative non-convergence of coordinate projection calculation. (a) α=θ; (b) α<θ
Fig. 4. Improved iterative calculation method. (a) Convergent situation; (b) non-convergent situation
Fig. 5. Basic principle of visual vector segmentation iterative calculation
Fig. 6. Flow chart of visual vector segmentation iterative calculation
Fig. 7. DEM thumbnails and DOM partial enlarged drawing in experimental area. (a) Plain; (b) hill; (c) mountain
Fig. 8. Four methods of imaging simulation results. (a),(b),(c) Result of ordinary iteration calculation method; (d),(e),(f) result of improved iteration calculation method; (g),(h),(i)result of partial exhaustion method; (j),(k),(l) result of visual vector segmentation iteration coordinate projection calculation method
m | 1 | 2 | 3 | 4 | 5 | 6 | 7 | 8 | 9 | 10 |
---|
N | N+10 | N/2+10 | N/3+15 | N/4+12 | N/5+15 | N/6+18 | N/7+21 | N/8+24 | N/9+27 | N/10+20 | 1 | 11 | | | | | | | | | | 2 | 12 | 11 | | | | | | | | | 3 | 13 | 11 | 16 | | | | | | | | 4 | 14 | 12 | 16 | 13 | | | | | | | 5 | 15 | 12 | 16 | 13 | 16 | | | | | | 6 | 16 | 13 | 17 | 13 | 16 | 19 | | | | | 7 | 17 | 13 | 17 | 13 | 16 | 19 | 22 | | | | 8 | 18 | 14 | 17 | 14 | 16 | 19 | 22 | 25 | | | 9 | 19 | 14 | 18 | 14 | 16 | 19 | 22 | 25 | 28 | | 10 | 20 | 15 | 18 | 14 | 17 | 19 | 22 | 25 | 28 | 21 | 20 | 30 | 20 | 21 | 17 | 19 | 21 | 23 | 26 | 29 | 22 | 30 | 40 | 25 | 25 | 19 | 21 | 23 | 25 | 27 | 30 | 23 | 40 | 50 | 30 | 28 | 22 | 23 | 24 | 26 | 29 | 31 | 24 | 50 | 60 | 35 | 31 | 24 | 25 | 26 | 28 | 30 | 32 | 25 | 60 | 70 | 40 | 35 | 27 | 27 | 28 | 29 | 31 | 33 | 26 | 70 | 80 | 45 | 38 | 29 | 29 | 29 | 31 | 32 | 34 | 27 | 80 | 90 | 50 | 41 | 32 | 31 | 32 | 32 | 34 | 35 | 28 | 90 | 100 | 55 | 45 | 34 | 33 | 33 | 33 | 35 | 37 | 29 | 100 | 110 | 60 | 48 | 37 | 35 | 34 | 35 | 36 | 38 | 30 |
|
Table 1. Calculation times of collinear condition equation required for different section intervals
Data set | Area | Topographical feature | DEM sampling distance /m | DOM sampling distance /m |
---|
1 | Dengfeng, Henan | Plain | 1 | 0.5 | 2 | Dengfeng, Henan | Hill | 1 | 0.5 | 3 | Dengfeng, Henan | Mountain | 1 | 0.5 |
|
Table 2. Information of simulated image experimental area
Data set | x direction | y direction |
---|
Maximum error /pixel | RMSE /pixel | Maximum error /pixel | RMSE /pixel |
---|
1 | 0.003029 | 0.001024 | 0.000021 | 0.000005 | 2 | 0.003268 | 0.002130 | 0.000192 | 0.000119 | 3 | 0.002469 | 0.001864 | 0.000149 | 0.000109 |
|
Table 3. Error statistical results of image coordinate calculated by visual vector segmentation iteration
Data set | Regular iteration time /ms | Improved iteration time /ms | Local exhaustivetime /ms | Proved method time /ms |
---|
1 | 352 | 389 | 395 | 385 | 2 | 532 | 462 | 559 | 469 | 3 | 3691 | 5464 | 157798 | 8531 |
|
Table 4. Iteration time statistical results of four methods