
Xian-ming DENG, Tian-cai ZHANG, Zeng-can LIU, Zhong-sheng LI, Jie XIONG, Yi-xiang ZHANG, Peng-hao LIU, Yi CEN, Fa-lin WU. Adaptability Analysis of Multiple Features Detection Algorithms Based on Fusion Degree Model Between Target and Environment[J]. Spectroscopy and Spectral Analysis, 2022, 42(4): 1285
- Spectroscopy and Spectral Analysis
- Vol. 42, Issue 4, 1285 (2022)
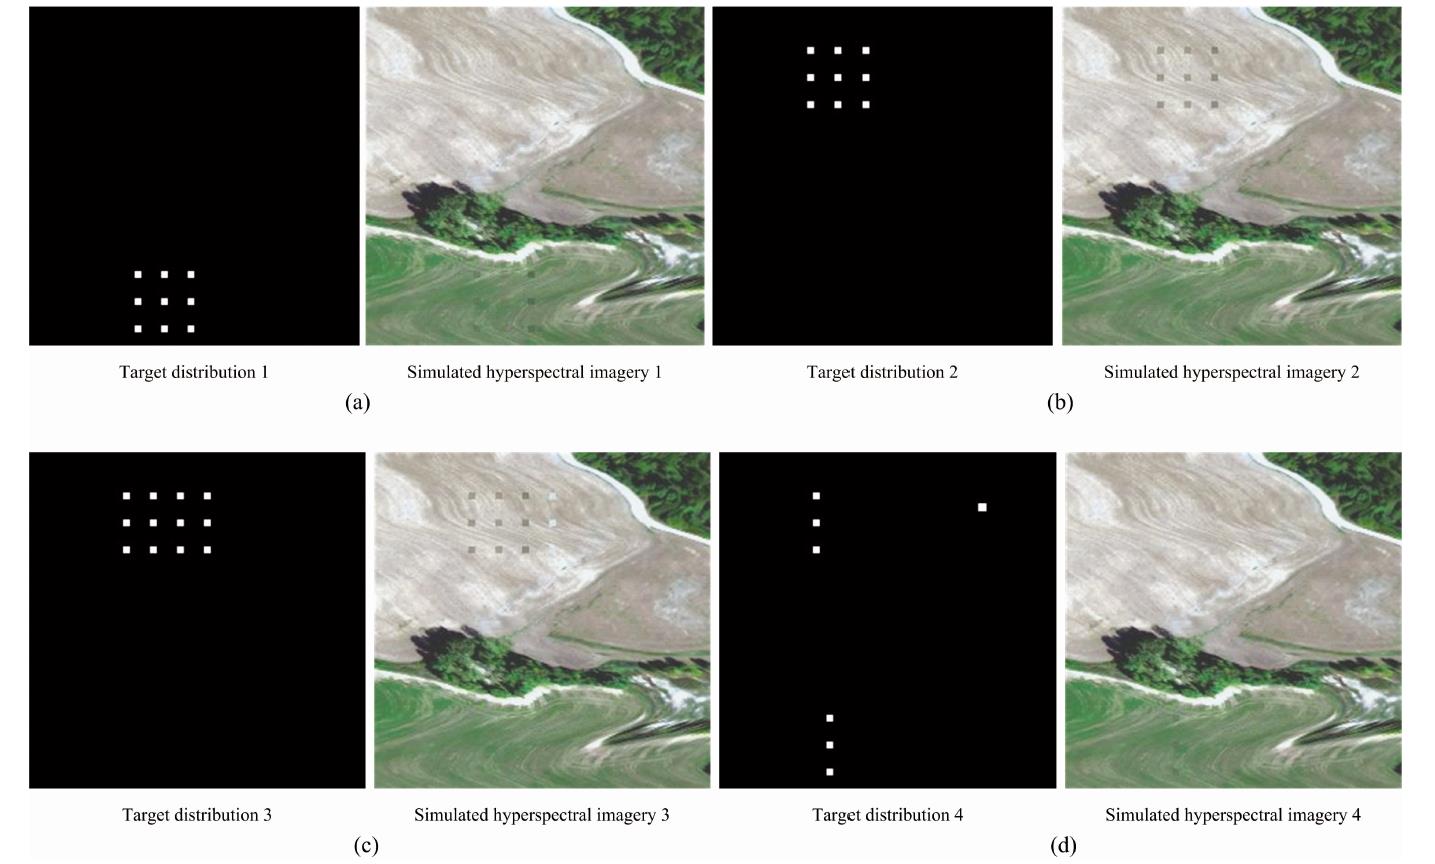
Fig. 1. Test scenarios
(a): Grassland background and vegetation camouflage target; (b): Soil background and vegetation camouflage target; (c): Soil background and vegetation and cement road camouflage targets; (d): Grassland/cement road/soil background and its corresponding camouflage targets
(a): Grassland background and vegetation camouflage target; (b): Soil background and vegetation camouflage target; (c): Soil background and vegetation and cement road camouflage targets; (d): Grassland/cement road/soil background and its corresponding camouflage targets
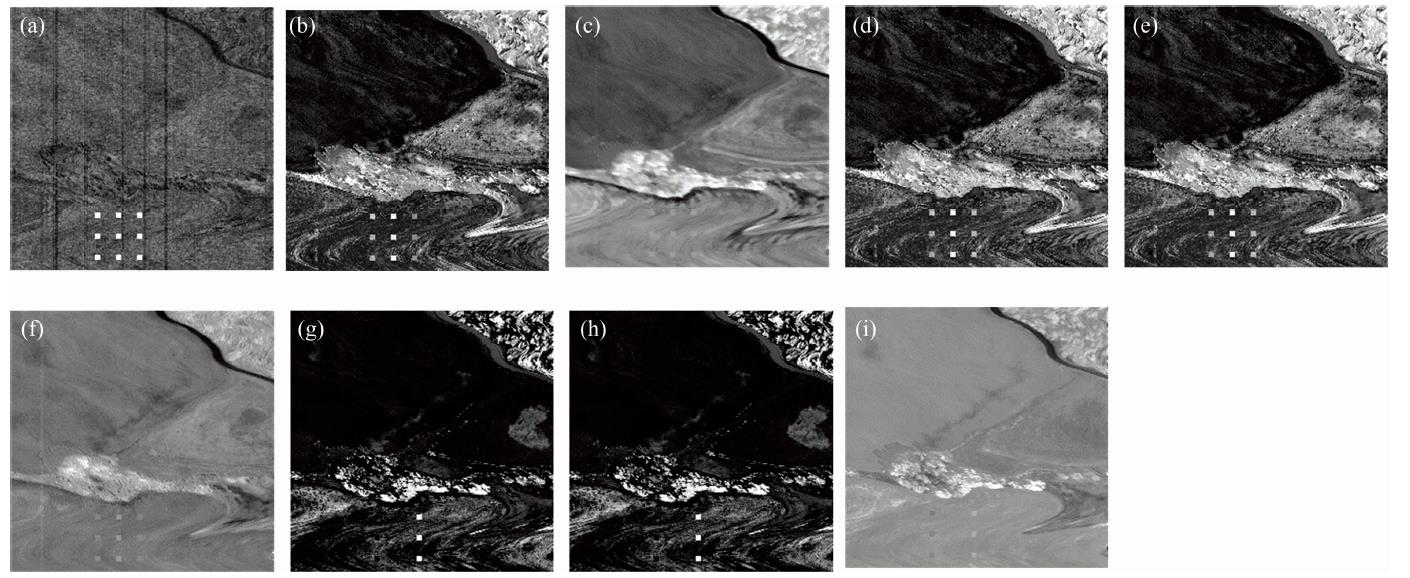
Fig. 2. Detection results of vegetation camouflage targets under grassland background using different algorithms
(a): MtACE; (b): MtAMF; (c): MtCEM; (d): SumACE; (e): SumAMF; (f): SumCEM; (g): WtaACE; (h): WtaAMF; (i): WtaCEM
(a): MtACE; (b): MtAMF; (c): MtCEM; (d): SumACE; (e): SumAMF; (f): SumCEM; (g): WtaACE; (h): WtaAMF; (i): WtaCEM
Fig. 3. Detection results of vegetation camouflage targets under soil background using different algorithms
(a): MtACE; (b): MtAMF; (c): MtCEM; (d): SumACE; (e): SumAMF; (f): SumCEM; (g): WtaACE; (h): WtaAMF; (i): WtaCEM
(a): MtACE; (b): MtAMF; (c): MtCEM; (d): SumACE; (e): SumAMF; (f): SumCEM; (g): WtaACE; (h): WtaAMF; (i): WtaCEM
Fig. 4. Detection results of vegetation and soil camouflage targets under soil background using different algorithms
(a): MtACE; (b): MtAMF; (c): MtCEM; (d): SumACE; (e): SumAMF; (f): SumCEM; (g): WtaACE; (h): WtaAMF; (i): WtaCEM
(a): MtACE; (b): MtAMF; (c): MtCEM; (d): SumACE; (e): SumAMF; (f): SumCEM; (g): WtaACE; (h): WtaAMF; (i): WtaCEM
Fig. 5. Detection results of vegetation/cement road/soil camouflage targets under grassland/cement road/soil background using different algorithms
(a): MtACE; (b): MtAMF; (c): MtCEM; (d): SumACE; (e): SumAMF; (f): SumCEM; (g): WtaACE; (h): WtaAMF; (i): WtaCEM
(a): MtACE; (b): MtAMF; (c): MtCEM; (d): SumACE; (e): SumAMF; (f): SumCEM; (g): WtaACE; (h): WtaAMF; (i): WtaCEM
Fig. 6. Detection results of four scenarios by nine multiple features detection algorithms
Fig. 7. Detection results of three SNR scenarios by nine multiple features detection algorithms
|
Table 1. Test scheme
|
Table 2. FD and accuracy parameter of test 1
|
Table 3. FD and accuracy parameter of test 2
|
Table 4. FD and accuracy parameter of test 3
|
Table 5. FD and accuracy parameter of test 4
|
Table 6. Detection results under different signal-to-noise ratios
| ||||||||||||||||||||||||||||||||||||||||||||||||||||||
Table 7. Statistics of detection mean and standard deviation of multi-feature detection algorithms in different scenarios

Set citation alerts for the article
Please enter your email address
© Copyright 2018-2021 | Chinese Laser Press. All Rights Reserved 沪ICP备15018463号-20