• Photonics Research
  • Vol. 11, Issue 6, 1075 (2023)
Yang Wang1、2、†, Weiqiang Wang1、5、†,*, Zhizhou Lu3、†, Xinyu Wang1、2, Long Huang1、2, Brent E. Little1, Sai T. Chu4, Wei Zhao1、2, and Wenfu Zhang1、2、6、*
Author Affiliations
  • 1State Key Laboratory of Transient Optics and Photonics, Xi’an Institute of Optics and Precision Mechanics, Chinese Academy of Sciences, Xi’an 710119, China
  • 2University of Chinese Academy of Sciences, Beijing 100049, China
  • 3Chongqing United Microelectronics Center (CUMEC), Chongqing 401332, China
  • 4Department of Physics and Materials Science, City University of Hong Kong, Hong Kong, China
  • 5e-mail: wwq@opt.ac.cn
  • 6e-mail: wfuzhang@opt.ac.cn
  • show less
    DOI: 10.1364/PRJ.486977 Cite this Article Set citation alerts
    Yang Wang, Weiqiang Wang, Zhizhou Lu, Xinyu Wang, Long Huang, Brent E. Little, Sai T. Chu, Wei Zhao, Wenfu Zhang. Hyperbolic resonant radiation of concomitant microcombs induced by cross-phase modulation[J]. Photonics Research, 2023, 11(6): 1075 Copy Citation Text show less
    CMC optical field evolution with walk-off parameter. A nonlinear phase shift is added to the probe field (red line). The optimal phase matching frequencies have maximum modulation instability gain, which forms RRs. For a micro-resonator with a standard parabolic dispersion curve, the walk-off parameter dpa is in proportion to the frequency difference between the probe and pump fields. The RRs occur on the intersection points of the dispersion curve and a line across the phase shift point “a” with slope of dpa. And the CMC optical field evolves from a symmetric structure to nearly a single peak spectrum along with the increase of |dpa|.
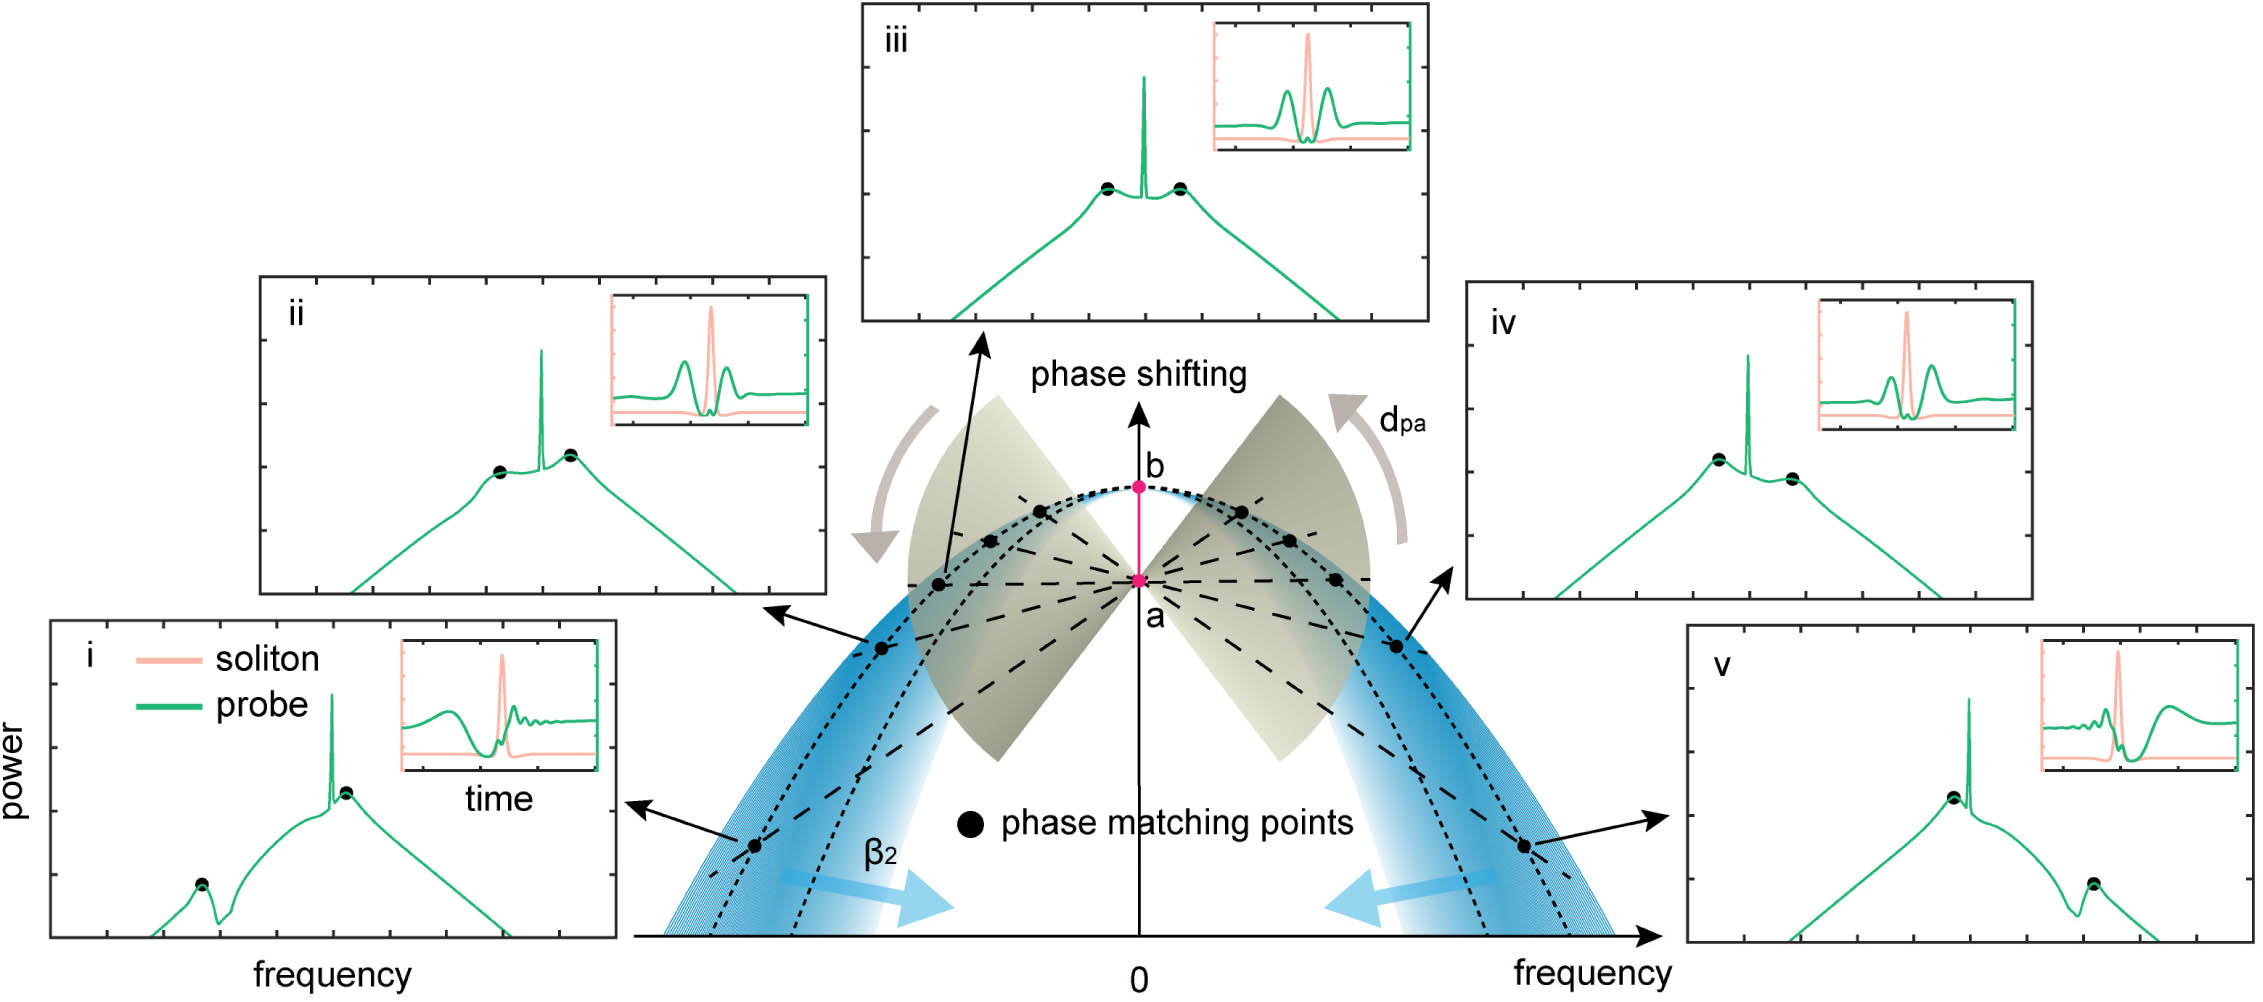
    Fig. 1. CMC optical field evolution with walk-off parameter. A nonlinear phase shift is added to the probe field (red line). The optimal phase matching frequencies have maximum modulation instability gain, which forms RRs. For a micro-resonator with a standard parabolic dispersion curve, the walk-off parameter dpa is in proportion to the frequency difference between the probe and pump fields. The RRs occur on the intersection points of the dispersion curve and a line across the phase shift point “a” with slope of dpa. And the CMC optical field evolves from a symmetric structure to nearly a single peak spectrum along with the increase of |dpa|.
    Experimental setup and results. (a) Schematic diagram of the experimental setup. (b) Measured optical spectra when the probe field has slower, similar, and faster group velocity, where the SMCs are used as pump for CMC generation. (c) Top view of MRR. (d) Calculated group velocity of the MRR.
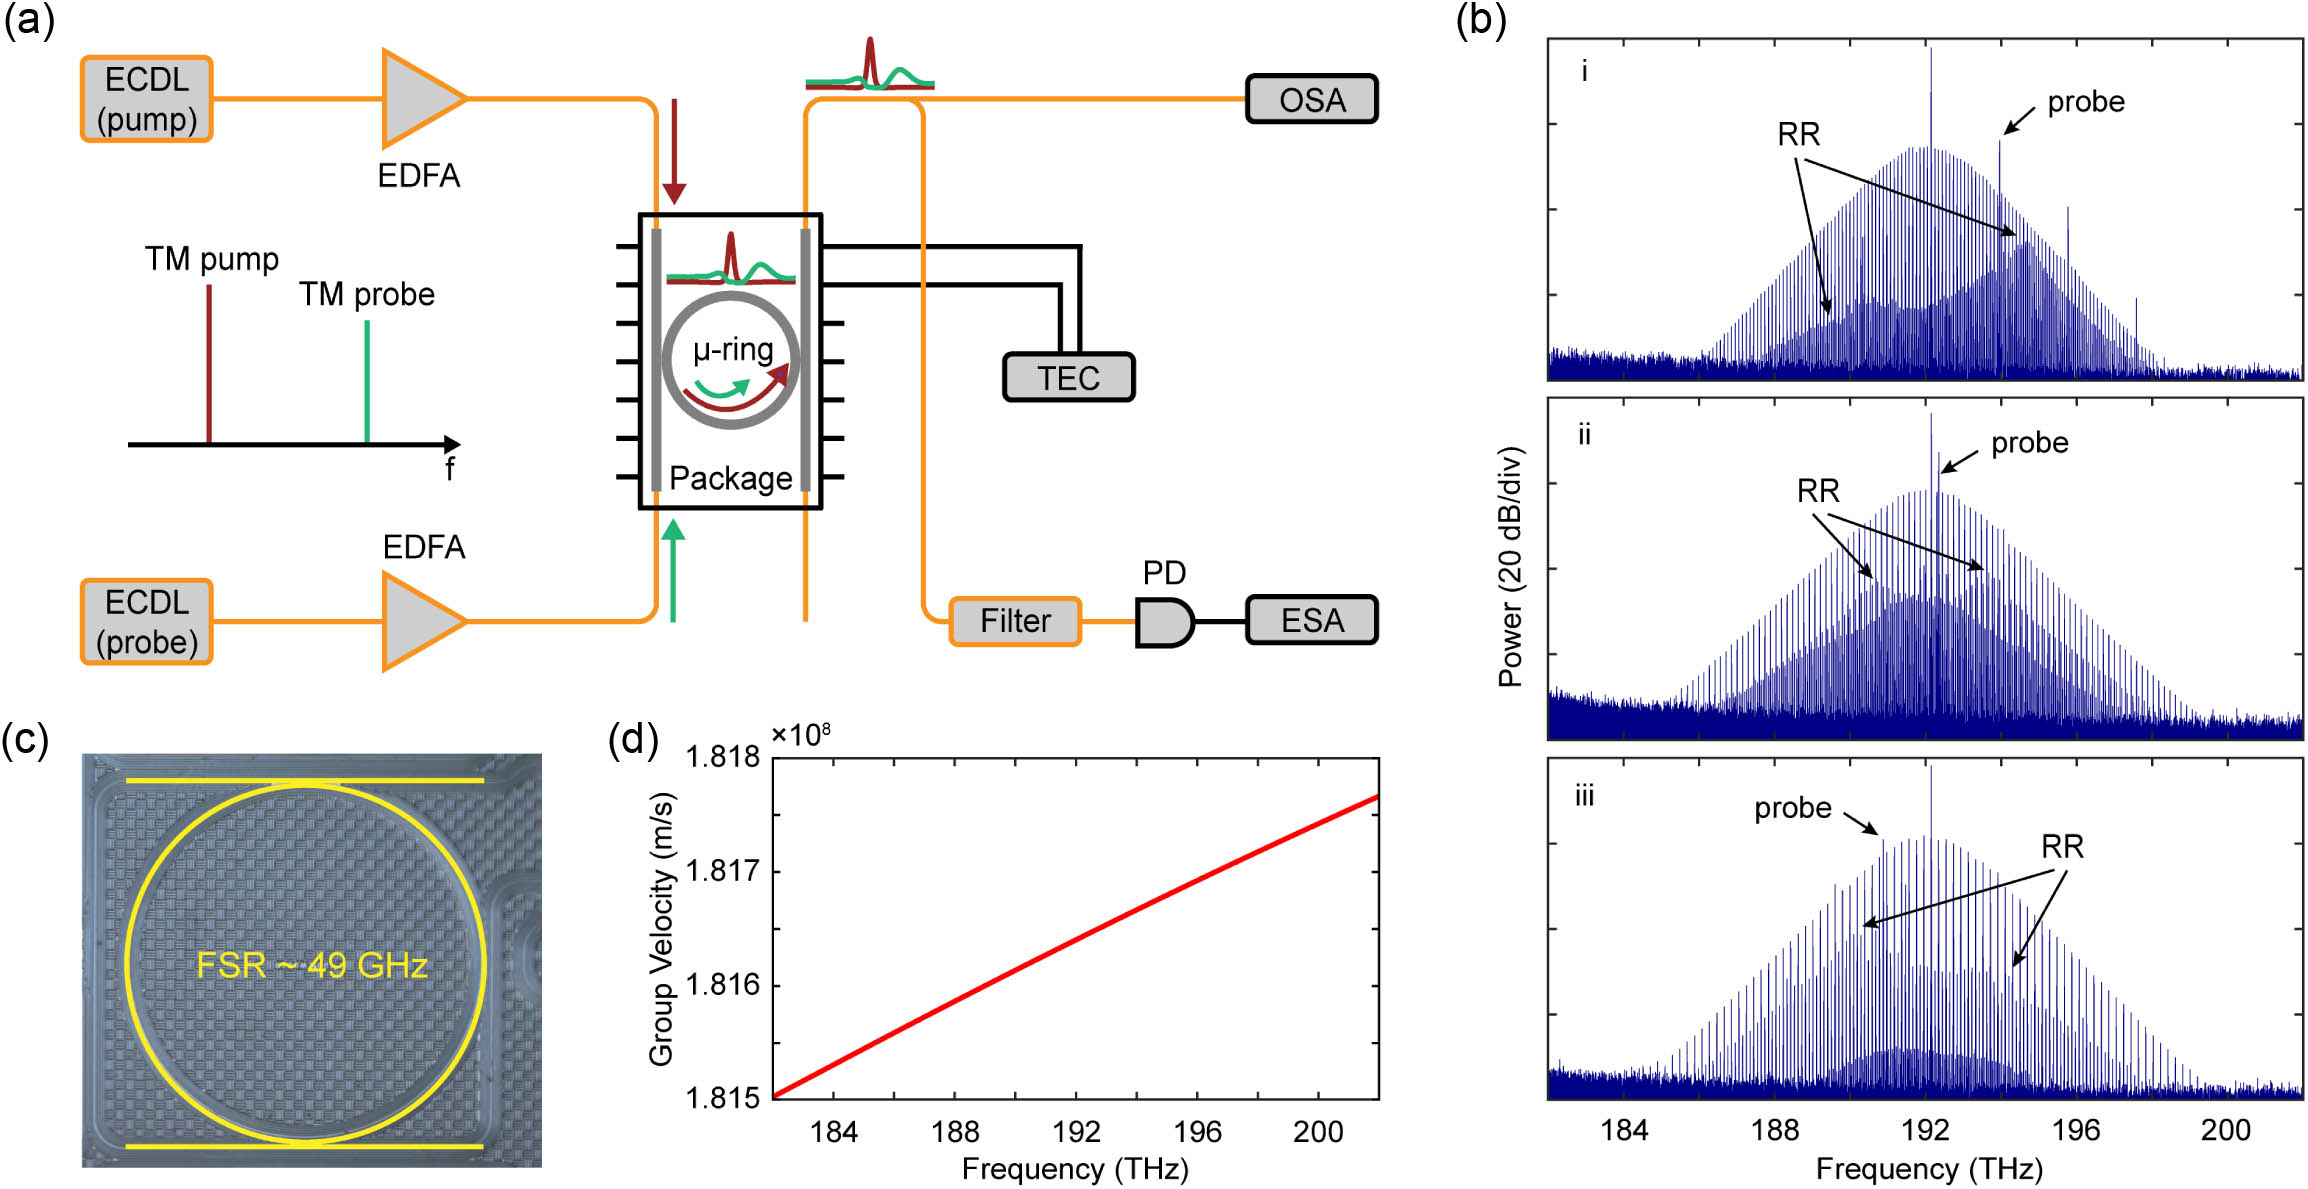
    Fig. 2. Experimental setup and results. (a) Schematic diagram of the experimental setup. (b) Measured optical spectra when the probe field has slower, similar, and faster group velocity, where the SMCs are used as pump for CMC generation. (c) Top view of MRR. (d) Calculated group velocity of the MRR.
    Temporal and spectral characteristics of CMC. (a)–(c) Calculated waveforms and spectra of CMC when dpa are positive, 0, and negative, respectively. (d)–(f) Measured optical spectra of CMC.
    Fig. 3. Temporal and spectral characteristics of CMC. (a)–(c) Calculated waveforms and spectra of CMC when dpa are positive, 0, and negative, respectively. (d)–(f) Measured optical spectra of CMC.
    Spectral characteristic of CMC. (a) and (b) show the optical spectral evolution along with dpa, which use the frequencies of probe and pump fields as the reference, respectively. (c) Typical optical spectra of CMC when dpa equals 2.0×10⁻¹², 0.5×10⁻¹², 0, −0.5×10⁻¹² and −2.0×10⁻¹² s/m, respectively.
    Fig. 4. Spectral characteristic of CMC. (a) and (b) show the optical spectral evolution along with dpa, which use the frequencies of probe and pump fields as the reference, respectively. (c) Typical optical spectra of CMC when dpa equals 2.0×10¹², 0.5×10¹², 0, 0.5×10¹² and 2.0×10¹²  s/m, respectively.
    Steady-state characteristics of the CMC. (a) Steady-state pump pulse (soliton pulse). (b) Frequency chirps induced by pump pulse by XPM effect. (c) Temporal waveform of steady-state CMC. (d) Optical spectrum of steady-state CMC. The modulated spectral envelope is caused by the constructive or destructive interference.
    Fig. 5. Steady-state characteristics of the CMC. (a) Steady-state pump pulse (soliton pulse). (b) Frequency chirps induced by pump pulse by XPM effect. (c) Temporal waveform of steady-state CMC. (d) Optical spectrum of steady-state CMC. The modulated spectral envelope is caused by the constructive or destructive interference.
    Effect of GVD and GVM on probe field. (a), (c), (e), (g) are the temporal domain distribution of pump field and probe field, and (b), (d), (f), (h) are the spectra of probe field. In (a), (b), (e), (f), the pump field is a noisy CW, and in (c), (d), (g), (h), the pump field is an SMC. In (a)–(d), only GVD effect is considered, and in (e)–(h), both GVD and GVM effects are considered simultaneously.
    Fig. 6. Effect of GVD and GVM on probe field. (a), (c), (e), (g) are the temporal domain distribution of pump field and probe field, and (b), (d), (f), (h) are the spectra of probe field. In (a), (b), (e), (f), the pump field is a noisy CW, and in (c), (d), (g), (h), the pump field is an SMC. In (a)–(d), only GVD effect is considered, and in (e)–(h), both GVD and GVM effects are considered simultaneously.
    Influence of GVD and GVM effects on XPM. (a) and (b) show the waterfall diagram of the spectrum of the probe field, which takes the wavelength of probe and pump light as the reference, respectively, where the black solid line represents the RR position.
    Fig. 7. Influence of GVD and GVM effects on XPM. (a) and (b) show the waterfall diagram of the spectrum of the probe field, which takes the wavelength of probe and pump light as the reference, respectively, where the black solid line represents the RR position.
    Yang Wang, Weiqiang Wang, Zhizhou Lu, Xinyu Wang, Long Huang, Brent E. Little, Sai T. Chu, Wei Zhao, Wenfu Zhang. Hyperbolic resonant radiation of concomitant microcombs induced by cross-phase modulation[J]. Photonics Research, 2023, 11(6): 1075
    Download Citation