• Spectroscopy and Spectral Analysis
  • Vol. 41, Issue 2, 586 (2021)
Zhi-wei SUN1、1、*, Xiao-lin WANG1、1, Qi-ming ZHANG1、1, Ju-min YUAN1、1, Shuang ZHANG1、1, Hui-feng YAN1、1, and Shu-sheng WANG1、1
Author Affiliations
  • 1[in Chinese]
  • 11. Tobacco Research Institute of Chinese Academy of Agricultural Sciences, Key Laboratory of Tobacco Biology and Processing, Ministry of Agriculture and Rural Affairs, Qingdao 266101, China
  • show less
    DOI: 10.3964/j.issn.1000-0593(2021)02-0586-06 Cite this Article
    Zhi-wei SUN, Xiao-lin WANG, Qi-ming ZHANG, Ju-min YUAN, Shuang ZHANG, Hui-feng YAN, Shu-sheng WANG. Diagnosis of Nitrogen Nutrition in Flue-Cured Tobacco Based on UAV Visible Spectrum Platform[J]. Spectroscopy and Spectral Analysis, 2021, 41(2): 586 Copy Citation Text show less
    Regression analysis between canopy color indexes and tobacco nitrogen indexes
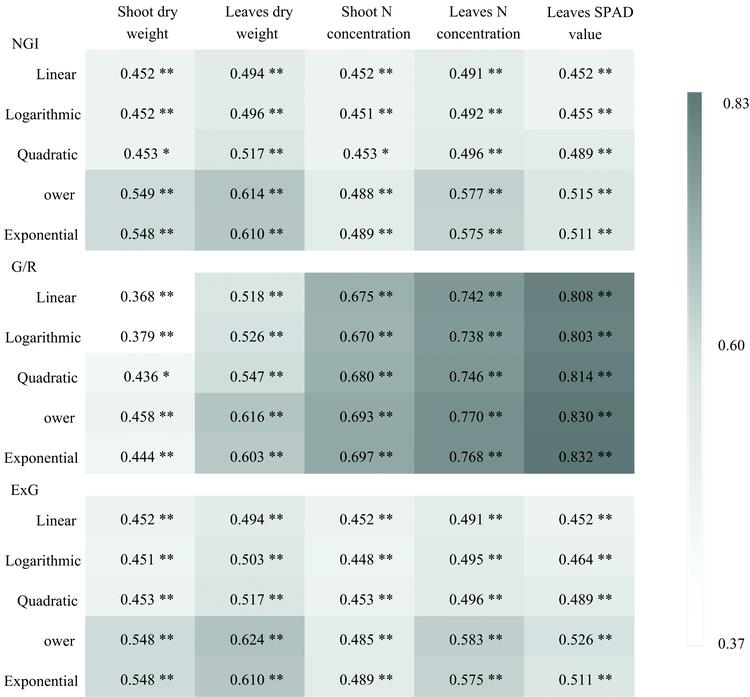
    Fig. 1. Regression analysis between canopy color indexes and tobacco nitrogen indexes
    Relationship between predicted and actual nitrogen concentrations in shoot and leaf of flue-cured tobacco using color index as independent variables
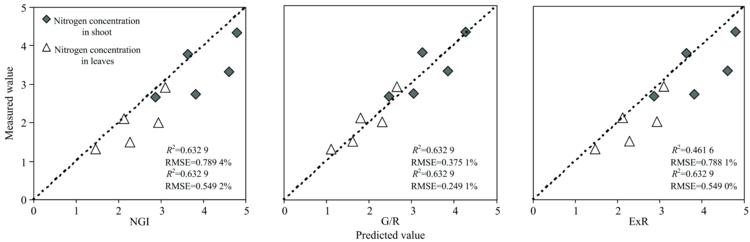
    Fig. 2. Relationship between predicted and actual nitrogen concentrations in shoot and leaf of flue-cured tobacco using color index as independent variables
    颜色指标类型颜色指标及计算方法参考文献
    归一化颜色指标NRI=R/(R+G+B)[8]
    NGI=G/(R+G+B)[4]
    NBI=B/(R+G+B)[9]
    比颜色指标G/R[8]
    G/B[5]
    G/(R+B)[10]
    归一化差分颜色指标(G-R)/(R+G+B)[11]
    (R-B)/(R+G+B)[10]
    (G-B)/(R+G+B)[12]
    ExG=(2G-R-B)/(G+R+B)[11]
    Table 1. Classification and calculation of color indexes
    处理团棵期旺长后期下部叶成熟期
    红光值R绿光值G蓝光值B红光值R绿光值G蓝光值B红光值R绿光值G蓝光值B
    N098.63 a125.66 a109.99 a120.52 a146.63 a85.81 a95.64 a113.94 a66.32 a
    N197.13 a126.08 a108.37 a104.21 b141.53 a78.42 b118.28 a133.26 a79.70 a
    N293.85 a124.55 a105.93 a93.96 c133.71 b75.10 c104.57 a120.59 a66.57 a
    N395.15 a124.20 a107.41 a88.02 cd128.93 bc74.61 c105.65 a122.38 a66.79 a
    N494.61 a124.67 a106.42 a81.46 de123.62 cd73.85 c108.54 a124.75 a67.60 a
    N594.53 a124.96 a107.11 a80.60 e122.18 d74.00 c96.23 a111.95 a64.51 a
    Table 2. Difference analysis of canopy image color standard values in different growth stages
    色彩指标地上部生物量叶片生物量地上部氮浓度叶片氮浓度叶片SPAD值
    NRI-0.560**-0.693**-0.828**-0.870**-0.930**
    NGI0.672**0.703**0.672**0.701**0.673**
    NBI0.2740.454*0.691**0.732**0.851**
    G/R0.606**0.720**0.822**0.862**0.899**
    G/B0.092-0.076-0.350-0.375-0.520**
    G/(R+B)0.672**0.700**0.673**0.699**0.669**
    (G-R)/(R+G+B)0.631**0.731**0.810**0.849**0.878**
    (G-B)/(R+G+B)0.3000.158-0.088-0.102-0.236
    (R-B)/(R+G+B)-0.465*-0.622**-0.804**-0.847**-0.934**
    ExG0.672**0.703**0.672**0.701**0.673**
    Table 3. Interdependency between canopy color indexes and tobacco nitrogen indexes
    Zhi-wei SUN, Xiao-lin WANG, Qi-ming ZHANG, Ju-min YUAN, Shuang ZHANG, Hui-feng YAN, Shu-sheng WANG. Diagnosis of Nitrogen Nutrition in Flue-Cured Tobacco Based on UAV Visible Spectrum Platform[J]. Spectroscopy and Spectral Analysis, 2021, 41(2): 586
    Download Citation