Abstract
We report on two strategies to design and implement the galvanometer-based laser-scanning mechanisms for the realization of reflectance confocal microscopy (RCM) and stimulated Raman scattering (SRS) microscopy systems. The RCM system uses a resonant galvanometer scanner driven by a home-built field-programmable gate array circuit with a novel dual-trigger mode and a home-built high-speed data acquisition card. The SRS system uses linear galvanometers with commercially available modules. We demonstrate video-rate high-resolution imaging at 11 frames per second of in vivo human skin with the RCM system and label-free biomolecular imaging of cancer cells with the SRS system. A comparison of the two strategies for controlling galvanometer scanners provides scientific and technical reference for future design and commercialization of various laser-scanning microscopes using galvanometers.Optical microscopy is an essential tool for biological research and biomedical applications. Traditional optical microscopy uses wide-field illumination with a two-dimensional (2D) area detector to form images. The disadvantages of wide-field microscopy include high background signals, pixel crosstalk, and limited spatial resolution. In contrast, laser-scanning confocal microscopy forms images through raster scanning of the laser focus in two dimensions across the sample, which achieves diffraction-limited spatial resolution, optical sectioning ability, and improved signal-to-noise ratio. In particular, reflectance confocal microscopy (RCM) is well suited for in vivo human imaging for clinical diagnosis of various disease conditions. The advantage of RCM is that it is a label-free technology, and its contrast originates from tissue modulation of the incident light. To achieve more specific contrasts, fluorescence confocal microscopy was developed mostly using extrageneous fluorescence labeling. In past decades, multiphoton microscopy with various contrast mechanisms, including two-photon fluorescence (2PF), three-photon fluorescence (3PF), second harmonic generation (SHG), third harmonic generation (THG), coherent anti-Stokes Raman scattering (CARS), and stimulated Raman scattering (SRS), has also been developed and applied for bioimaging applications. Multiphoton microscopy uses tightly focused near infrared (NIR) laser beams for excitation and therefore achieves deeper tissue imaging with reduced phototoxicity.
It is noted that one core technology in common for nearly all laser-scanning microscopes is the scanning mechanism. Laser beam scanning can be realized using various technologies, such as 2D motorized sample stage, micro-electromechanical system (MEMS), polygon mirror, and galvanometer, among which the galvanometer is most commonly used in laser-scanning microscopy. In this Letter, we report on the design and implementation of two galvanometer-based scanning schemes for RCM[1–5] and SRS[6–8] microscopy, respectively. The RCM system used a resonant galvanometer with a home-built field-programmable gate array (FPGA)-based circuit and high-speed data acquisition card (DAQ) and image reconstruction software, while the SRS system used non-resonant linear galvanometers with commercially available modules controlled by partially open-source software ScanImage. We then tested the performance of the RCM for in vivo human skin imaging and demonstrated the use of SRS microscopy for imaging lipids and protein in unstained live cancer cells. Our side by side design, realization, and comparison of the two schemes for controlling galvanometer scanners provide scientific and technical reference for future design and commercialization of various laser-scanning microscopes using galvanometers[9–11].
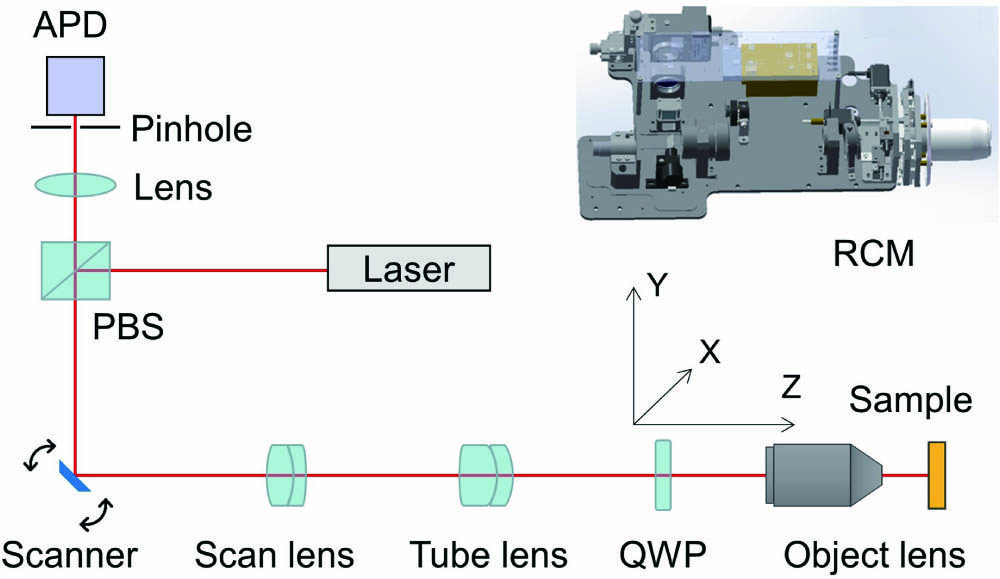
The basic layout of the optical path of the RCM system we built is shown in Fig. 1. A 50 mW NIR laser at 830 nm served as the point light source (W830FC-50, Pavilion Integration Corporation). The laser beam was introduced on the biological sample through a polarizing beam splitter (PBS), the resonant galvanometer scanner, a scan lens, a tube lens, a quarter-wave plate (QWP), and an infinity-corrected objective lens. The objective lens focused the collimated laser beam on the sample. The reflected photons that carry structural and morphological information of the sample were collected and redirected by the QWP and PBS onto a silicon avalanche photodiode (APD120A/M, Thorlabs Inc.), which significantly improved the signal-to-noise ratio. A pinhole with a diameter 25 μm was placed in front of the APD to block the photons out of the focal spot. This pinhole size was determined based on the theoretical resolution of the objective for confocal imaging. This reflectance confocal configuration improved imaging resolution in both lateral and longitudinal directions and achieved optical sectioning ability. Imaging was realized through 2D raster scanning of the laser beam by the resonant galvanometer scanner unit along the X direction. The scanning angle and therefore the field of view (FOV) were limited by the back aperture of the objective lens. In our setup, a three-dimensional (3D) motorized mechanism was developed to enable up to 14 × 14 mosaic imaging in the XY plane, as well as depth imaging along the Z direction.
Sign up for Chinese Optics Letters TOC. Get the latest issue of Chinese Optics Letters delivered right to you!Sign up now

Figure 1.Optical path layout of the RCM system. APD, avalanche photodiode; PBS, polarizing beam splitter; QWP, quarter-wave plate; RCM, reflectance confocal microscope.
Figure 2 shows the diagram of the electrical control and data acquisition system of the RCM, which was composed of three modules, including the FPGA-based circuit for controlling the resonant galvanometer (; CRS series 12 kHz, Cambridge Technology Inc.) and the linear galvanometer (; 6215 H, Cambridge Technology Inc.), the advanced reduced instruction set computing (RISC) machine (ARM)-based circuit for controlling the 3D motorized sample stage, and a home-built DAQ to fulfill the demanding data transfer speed. The circuits communicated with the computer through an RS-232 port. Note that we did not use the commercial galvanometer control circuits.
Figure 2.Electrical control and data acquisition diagram of the RCM.
Figure 3 shows the wave profiles of the electrical signals for controlling the galvanometers and the frame trigger. The resonant galvanometer vibrates at a constant frequency of 12 kHz, which served as the square-wave line reference. The line sampling trigger was set with a π phase delay to the line reference signals and counted for 1024 lines per frame. The linear galvanometer was driven by a sawtooth wave signal. A frame trigger was achieved by counting the number of lines per frame. The frame trigger enabled data acquisition for one frame imaging () with a constant high transistor–transistor logic (TTL) voltage and disabled data acquisition for a fly back time () with the low TTL voltage. In our experiment, was about 43 ms, and was about 2 ms.
Figure 3.Control principle diagram in the RCM system.
It was important to synchronize galvanometers scanning to data acquisition and image formation. This was realized by the FPGA-based circuit in our system, as illustrated in Fig. 4. We used both a line trigger and a frame trigger for synchronization and data registration, a so-called dual-trigger mode. Compared with other systems that use only the line trigger control signals, our system has unique advantages. First, when a large amount of imaging data is transferring, the loss of one or a few lines of data points will cause the frame “jumping up” problem. Using the dual-trigger mode, this artifact when it occurs will not be passed to the next frame, which can significantly improve the robustness of the video-rate imaging. If only using the line trigger, one cannot fix the positioning of the next frame image in the memory. While the handshake protocol can be used to ensure data integrity, the complexity of the software and computing load is dramatically increased, affecting the video-rate imaging speed. Second, the temporal synchronization among the resonant galvanometer, the linear galvanometer, and data acquisition can achieve very high temporal accuracy down to 1 μs. If only the line trigger is used, the temporal precision can easily be worse than 1 μs, which will affect image reconstruction and distortion correction[12].
Figure 4.FPGA controller realized synchronization of galvanometer scanning, data acquisition, and image formation.
We designed a DAQ because no commercial cards actually met our demanding data acquisition speed at a reasonable price. To achieve video-rate imaging, a frame rate frames per second (fps) was required, and each frame has for high-resolution imaging. Considering pixel binning to increase the signal-to-noise ratio, we required the sampling rate higher than 250 MSa/s and data transfer speed more than 200 Mb/s. In addition, the absolute accuracy of the card must be down to 2 mV to detect the weak confocal signals.
Unlike a linear galvanometer, the voltage to drive a resonant galvanometer is not linear, which introduces image distortion. To correct the image distortion, we applied the following equation to correlate line pixel positioning with sampling time points: where is the position function along time ; is the focal length of the objective; is the half-scan angle at time ; is the maximum scan angle of the resonant galvanometer; is the scanning frequency of the resonant galvanometer; is the initial phase.
We demonstrated our RCM system for in vivo human skin imaging at video-rate speed, as shown in Fig. 5. The experiments were performed in accordance with a fully approved institutional review board (IRB) protocol. We used a water-immersion objective lens with a numerical aperture (NA) of 0.5 for skin imaging. The bright “dots” shown in the reflection confocal image were cell nuclei. We found that in our image single cell nuclei could be readily identified due to the high spatial resolution. The viable cells featured by cell nuclei shown in the image indicated that the current imaging layer was beneath the stratum corneum of the skin, demonstrating good tissue penetration and optical sectioning ability of the RCM system.
Figure 5.Demonstration of in vivo video-rate imaging of human skin using the RCM system we designed. Scale bar, 150 μm; frame rate, 11 fps.
To quantitatively evaluate the spatial resolution of the established RCM system, we imaged 100 nm gold nanoparticles. We measured the full width at half-maximum (FWHM) of the intensity profiles of single gold nanoparticles and reported the actual lateral resolution at ∼1.25 μm and z resolution at ∼7 μm, corresponding to the theoretical values of 1.25 μm and 6.7 μm, respectively. We found that the actual spatial resolution was worse than the theoretical values to a reasonable extent. Considering the average size of mammalian cell nuclei is ∼10 μm, this spatial resolution is sufficient to visualize single cells in the human skin with a good optical sectioning capability. Note that by using a higher NA objective lens we could further improve the spatial resolution of the imaging.
For the second part of the work, we developed an SRS microscope using two linear galvanometers and their controllers, which were mostly commercially available. The schematic of the optical path of our SRS microscope is shown in Fig. 6. A dual-color, tunable NIR laser source was used (Insight X3, Spectra-Physics). For SRS imaging, the tunable beam from the laser () served as the pump beam, and the fixed beam at 1045 nm served as the Stokes beam, which was modulated at 10 MHz using an electro-optic amplitude modulator (EOM). Spectral focusing technology was adopted to improve the spectral resolution for SRS imaging using two glass rods with a high refractive index[13]. Laser beam scanning was achieved using a 2D linear galvanometer system and the controllers (GVS002 and GPS011) that were purchased from Thorlabs Inc. The detector was a large-area silicon photodiode (FDS1010, Thorlabs Inc.). The electrical signal from the photodiode was sent to a lock-in amplifier (HF2L1, Zurich Instruments) to demodulate the pump beam to retrieve the SRS signal. A commercial DAQ (NI-USB-6366) was used for data collection. Mosaic imaging was achieved using a motorized stage (Z-Deck, Prior Scientific).
Figure 6.Optical path of the SRS microscope. EOM, electro-optic modulator; HWP, half-wave plate.
The electrical control and data acquisition diagram of the SRS microscope is shown in Fig. 7. We used the partial open-source software ScanImage to control the entire microscopic system for scanning and data acquisition[14]. The imaging speed of each frame in the SRS system was from one to a few seconds, and therefore the speed of sampling and data transfer was not demanding. Compared with the video-rate RCM system, establishing the SRS setup did not require much customized electronic work. ScanImage has several built-in schemes to drive galvanometers. To realize system control and data acquisition, we only needed to complete several configurations and settings including image resolution, channel control, pixels per line, lines per frame, frame rate, unidirectional or bidirectional scan, pixel dwell time, line period, pixel bin factor, line period, and acquisition modes. ScanImage also provides the interface to extend functions, such as mosaic imaging via synchronizing the motorized stage with galvanometer scanning.
Figure 7.Electrical and data acquisition diagram of the SRS microscope.
By tuning the frequency of the pump beam (), SRS imaging was achieved at a pre-defined Raman peak: , where is the frequency of Stokes beam. As shown in Fig. 8, we imaged live ovarian cancer cells with SRS at Raman shifts of and , which correspond to chemical bonds in lipids and in proteins, respectively. Accumulated lipid droplets down to 1 μm size were visualized in the image with lipid contrast, indicating that the cancer cells had abnormal lipid metabolism. In contrast, cell nuclei were visualized in the protein imaging channel. The small round-shape nucleoli were clearly identified in the cell nuclei, showing the high spatial resolution of SRS. Previous work has demonstrated that lipid and protein overlay images can be used for pathological diagnosis of brain tumors[15].
Figure 8.SRS images of live SKOV-3 ovarian cancer cells at (left, ; lipids) and (, proteins). The cell line was purchased from American Type Culture Collection (ATCC) and cultured in McCoy’s 5A Medium (ATCC) with 10% fetal bovine serum (ATCC) for 24 h on a glass coverslip before imaging. The images were acquired with , and the dwell time of each pixel was 10 μs.
It is inspiring to compare the two systems in several aspects. Both the RCM and SRS microscopes can image label-free biological cells and tissues. The contrast of RCM originates from linear reflection and absorption of light interacting with the tissue, while the contrast of SRS relies on Raman scattering of the chemical bonds in the biomolecules. SRS exhibits chemical contrasts which represent a strong advantage over RCM. To achieve high 3D spatial resolution, RCM uses the confocal effect, while SRS takes advantage of the third-order multiphoton process to confine signal generation only within the tightly focused focal volume. Although both RCM and SRS prefer to use NIR laser sources, RCM can use low-cost, low-power continuous wave lasers, but SRS can only use dual-color tunable femtosecond or picosecond lasers.
Currently, a typical commercially available RCM system for in vivo confocal skin imaging is the VIVASCOPE offered by the CALIBER I.D. Inc. In the VIVASCOPE setup, rapid scanning is achieved by using a polygon mirror, while in our home-built RCM system, a 12 kHz resonant galvanometer was used. The dual-trigger mode we developed and implemented in our RCM system effectively avoided the frame “jumping up” issue, which represents a unique advantage over other video-rate confocal imaging systems. Compared with polygon mirrors, galvanometers exhibit more accurate and stable scanning frequency and are much smaller and lighter for compact and portable design. The advantages of the home-built SRS system include easy implementation using commercially available optoelectrical modules and parts, low cost, and full flexibility of optical path changes for new experiments.
Based on the work reported in this Letter, we note that to build up a feasible laser-scanning imaging system, several essential factors must be considered: the sensitivity and bandwidth of the detectors, the maximum sampling rate and the absolution accuracy of the data card, the interface speed between the computer and data card, and the strategy to generate the output voltage and trigger signals.
In summary, the emphasis of this Letter is to present our two different strategies to implement the galvanometer-based laser-beam-scanning mechanism. While we built the RCM system using the video-rate galvanometer and built the SRS system using the linear galvanometers, they are indeed interchangeable. In future work, the two complementary imaging modalities (RCM and SRS) will be integrated into a single system for skin imaging and skin lesion detection towards clinical use.
References
[1] Q. Luo, Z. Zhang. Biomedical Photonics(2018).
[2] P. Xi, B. Rajwa, A. T. Jones, J. P. Robinson. Am. J. Phys., 75, 203(2007).
[3] J. B. Pawley. Handbook of Biological Confocal Microscopy(1995).
[4] R. H Webb. Rep. Prog. Phys., 59, 427(1996).
[5] J. R. Bumstead, J. J. Park, I. A Rosen, A. W. Kraft, P. W. Wright, M. D. Reisman, D. C Côté, J. P. Culver. Neurophotonics, 5, 025001(2018).
[6] C. W. Freudiger, W. Min, B. G. Saar, S. Lu, G. Holtom, C. He, J. Tsai, J. Kang, X. Xie. Science, 322, 1857(2008).
[7] F.-K. Lu, S. Basu, V. Igras, M. Hoang, M. Ji, D. Fu, G. R. Holtom, V. A. Neel, C. W. Freudiger, D. E. Fisher, X. S. Xie. Proc. Natl. Acad. Sci., 112, 11624(2005).
[8] F.-K. Lu, M. Ji, D. Fu, X. Ni, C. W. Freudiger, G. Holtom, X. S. Xie. Mol. Phys., 110, 1927(2012).
[9] S. W. Paddock. Mol. Biotechnol., 16, 127(2000).
[10] Z. Qiu, W. Piyawattanametha. IEEE J. Sel. Top. Quantum Electron, 21, 376(2015).
[11] L. Evans, E. O. Potma, M. Puoris’haag, D. Côté, C. P. Lin, X. S. Xie. Proc. Natl. Acad. Sci., 102, 16807(2005).
[12] L. Chuang, Z. Yunhai, H. Wei, T. Yuguo. Infrared Laser Eng., 47, 1041003(2018).
[13] Y. Yuan, N. Shah, F. Lu. Proc. SPIE, 11244, 112442N(2020).
[14] T. A. Pologruto, B. L. Sabatini, K. Svoboda. Biomed. Eng. Online, 2, 13(2003).
[15] F.-K. Lu, D. Calligaris, O. I. Olubiyi, I. Norton, W. Yang, S. Santagata, X. S. Xie, A. J. Golby, N. Y. R. Agar. Cancer Res., 76, 3451(2016).