Author Affiliations
School of Electronic and Information Engineering, Lanzhou Jiaotong University, Lanzhou, Gansu 730070, Chinashow less
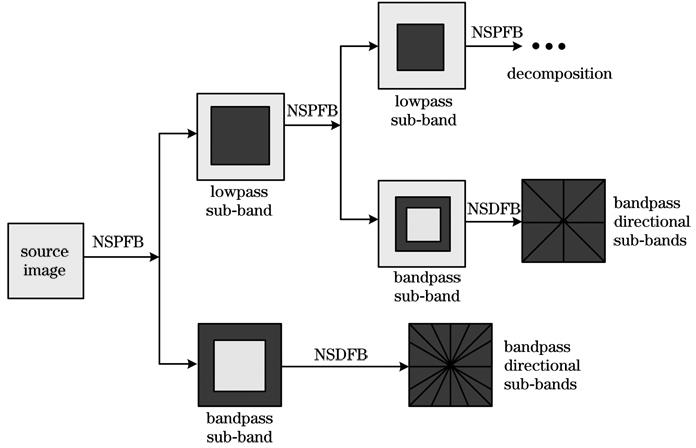
Fig. 1. Decomposition process of NSCT
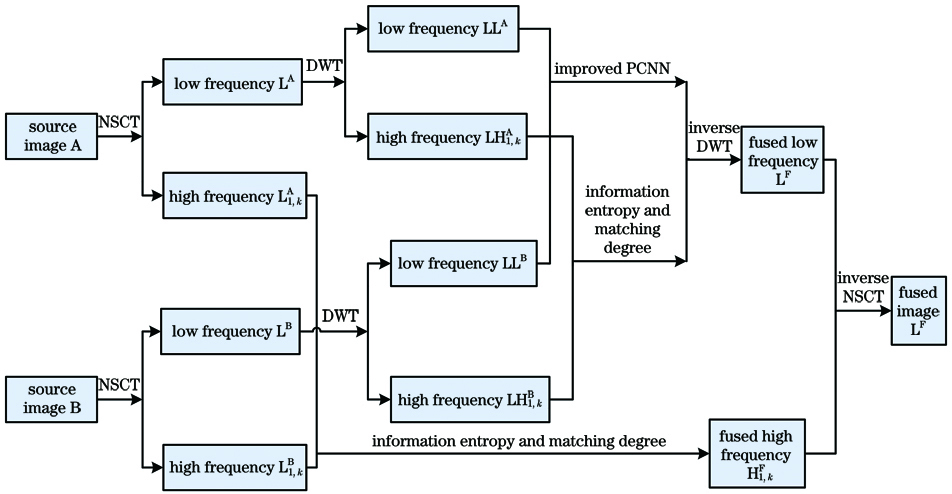
Fig. 2. Flow chart of the proposed algorithm
Fig. 3. Simplified model of neuron in PCNN
Fig. 4. Framework chart of low frequency subband component fusion
Fig. 5. CT/MRI source images and image fusion results by different algorithms
Fig. 6. Flow chart of MRI/PET image fusion
Fig. 7. MRI/PET source images and image fusion results by different algorithms
Method | IE | AG | SF | SD |
---|
Algorithm 1 | 6.5498 | 6.8525 | 16.5593 | 58.6421 | Algorithm 2 | 6.3269 | 6.4023 | 16.8470 | 50.7436 | Algorithm 3 | 5.8516 | 4.7560 | 9.4149 | 43.6581 | Proposed algorithm | 6.8415 | 7.2316 | 17.1296 | 57.6361 |
|
Table 1. Evaluation indicators for the first group of images
Method | IE | AG | SF | SD |
---|
Algorithm 1 | 4.7202 | 9.9061 | 30.8452 | 84.4055 | Algorithm 2 | 4.6470 | 9.3234 | 32.1094 | 85.0626 | Algorithm 3 | 4.3131 | 7.2921 | 27.3694 | 63.1978 | Proposed algorithm | 5.0302 | 10.1685 | 31.4722 | 87.0621 |
|
Table 2. Evaluation indicators for the second group of images
Method | IE | AG | SF | SD |
---|
Algorithm 1 | 4.9044 | 7.5525 | 27.5704 | 82.8691 | Algorithm 2 | 4.5208 | 8.2945 | 27.8275 | 80.7933 | Algorithm 3 | 4.0943 | 5.2739 | 25.4892 | 77.2424 | Proposed algorithm | 5.1142 | 9.4119 | 30.4588 | 85.5517 |
|
Table 3. Evaluation indicators for the third group of images
Method | IE | AG | SF | SD |
---|
Algorithm 1 | 4.5860 | 10.3529 | 30.2666 | 81.3725 | Algorithm 2 | 4.5837 | 7.8718 | 26.1864 | 85.1571 | Algorithm 3 | 4.4134 | 6.4476 | 17.8729 | 69.2850 | Proposed algorithm | 4.8187 | 10.3768 | 31.3671 | 87.9695 |
|
Table 4. Evaluation indicators for the fourth group of images
Method | IE | AG | SF | SD |
---|
Algorithm 1 | 4.8232 | 7.4481 | 24.3951 | 78.2887 | Algorithm 2 | 4.6965 | 6.6857 | 22.8195 | 68.1525 | Algorithm 3 | 4.5910 | 4.8094 | 18.8472 | 73.4640 | Proposed algorithm | 5.3986 | 8.1815 | 21.1684 | 79.0407 |
|
Table 5. Evaluation indicators for the fifth group of images
Method | IE | AG | SF | SD |
---|
Algorithm 1 | 4.2714 | 8.9279 | 28.3091 | 68.3905 | Algorithm 3 | 4.2399 | 6.3729 | 22.7939 | 71.8809 | Algorithm 3 | 4.0271 | 5.5916 | 16.2866 | 53.8390 | Proposed algorithm | 4.4342 | 9.0242 | 26.7969 | 75.2246 |
|
Table 6. Evaluation indicators for the sixth group of images