• Infrared and Laser Engineering
  • Vol. 50, Issue 6, 20211035 (2021)
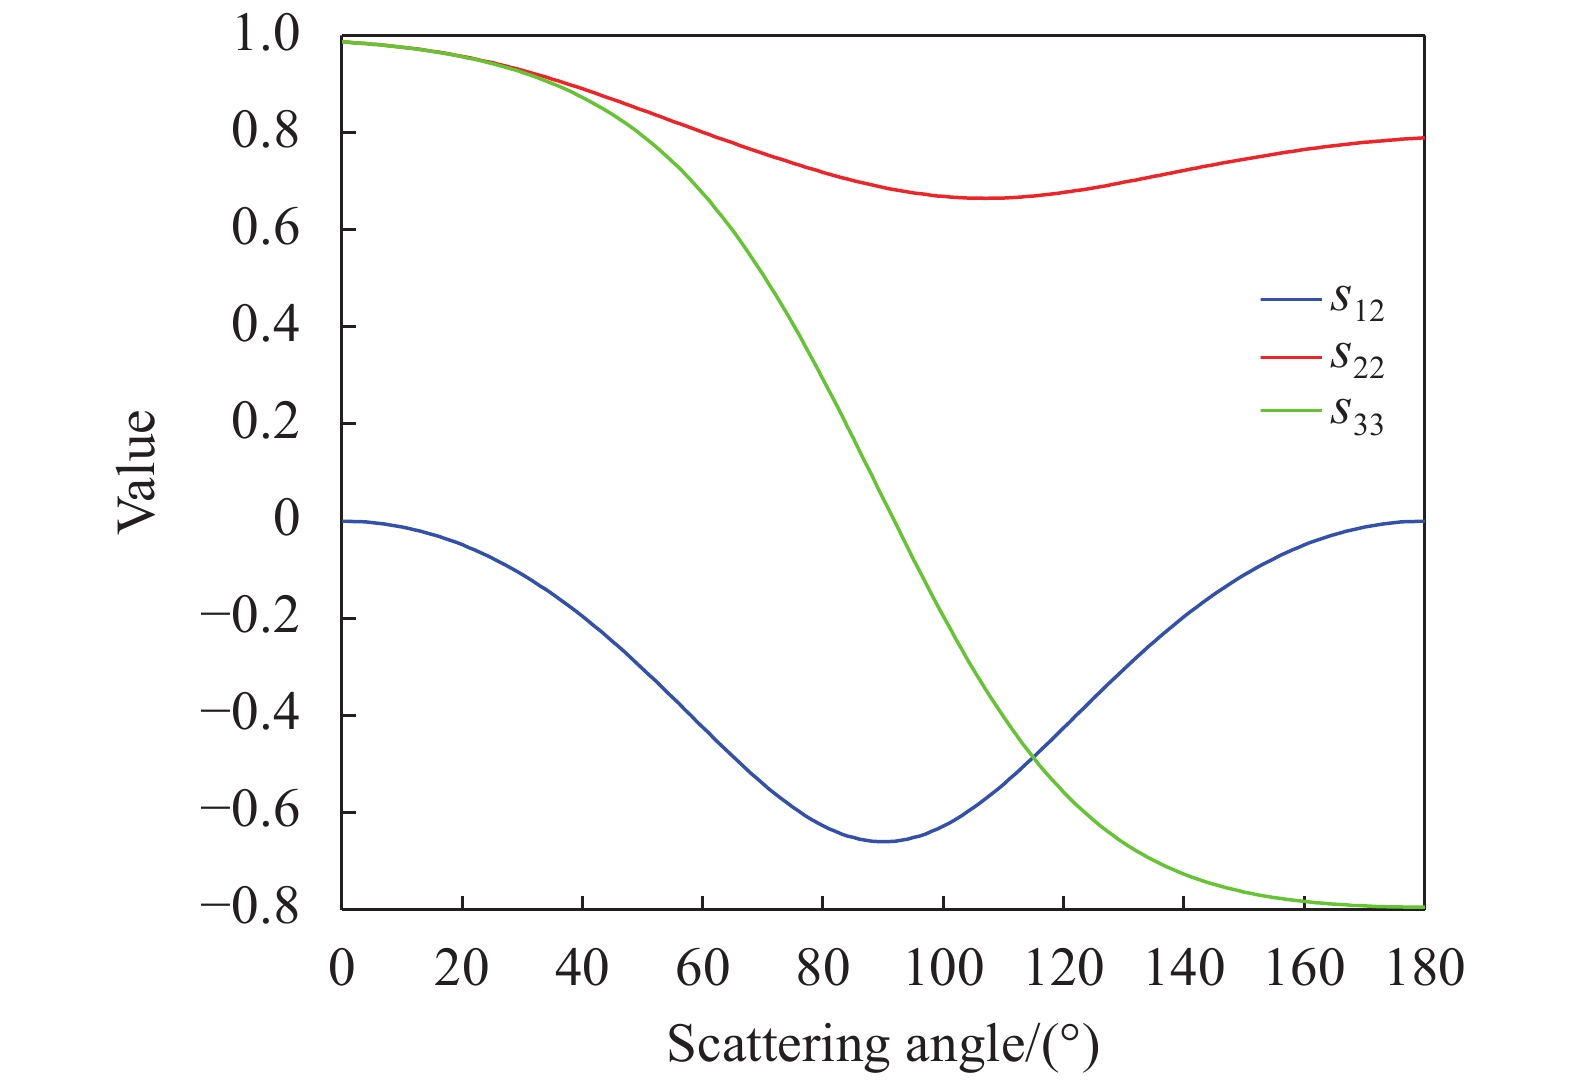
Ke Li1, Bingyi Liu1、2, Qian Yang3, Junwu Tang2, and Songhua Wu1、2
Author Affiliations
  • 1Faulty of Information Science and Engineering, Ocean University of China, Qingdao 266100, China
  • 2Laboratory for Regional Oceanography and Numerical Modeling, Qingdao National Laboratory for Marine Science and Technology, Qingdao 266237, China
  • 3Institute of Oceanographic Instrumentation, Qilu University of Technology (Shandong Academy of Sciences), Qingdao 266071, China
  • show less
    DOI: 10.3788/IRLA20211035 Cite this Article
    Ke Li, Bingyi Liu, Qian Yang, Junwu Tang, Songhua Wu. Simulation of polarization profiles of water measured by oceanographic lidar[J]. Infrared and Laser Engineering, 2021, 50(6): 20211035 Copy Citation Text show less
    Relationship between s12, s22, s33 and particle scattering angle
    Fig. 1. Relationship between s12, s22, s33 and particle scattering angle
    Flowchart of polarization Monte Carlo simulation
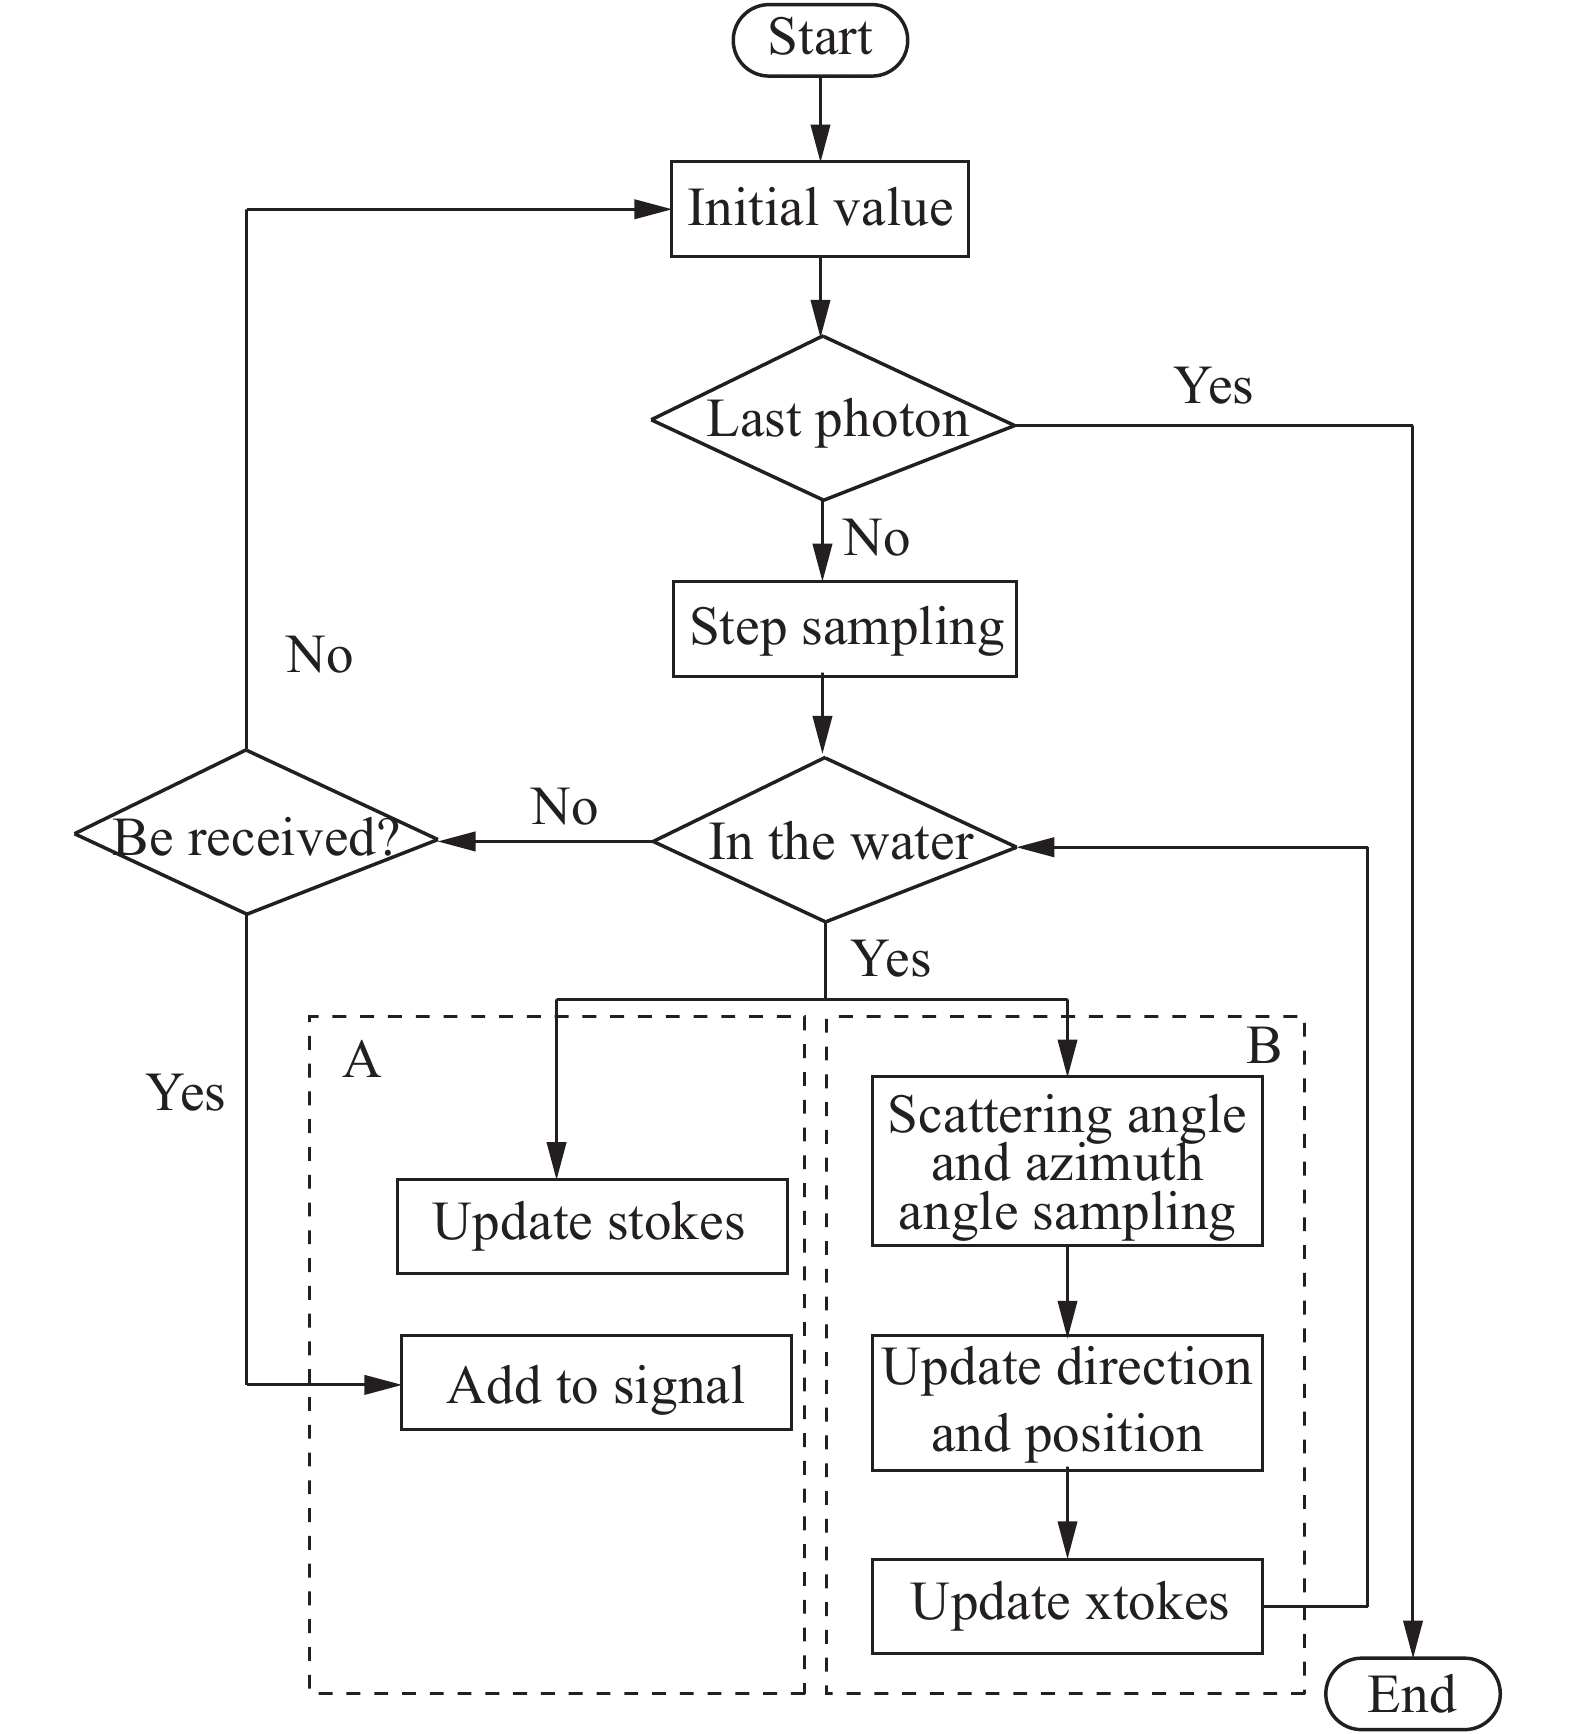
    Fig. 2. Flowchart of polarization Monte Carlo simulation
    Geometric diagram of the meridian and scattering planes
    Fig. 3. Geometric diagram of the meridian and scattering planes
    (a) Profile of chlorophyll-a concentration in low, medium and high scattering layer; (b) Absorption coefficient a profile; (c) Scattering coefficient b profile
    Fig. 4. (a) Profile of chlorophyll-a concentration in low, medium and high scattering layer; (b) Absorption coefficient a profile; (c) Scattering coefficient b profile
    Simulated shipborne oceanographic lidar return signals in (a) low, (b) medium and (c) high scattering layer
    Fig. 5. Simulated shipborne oceanographic lidar return signals in (a) low, (b) medium and (c) high scattering layer
    Depolarization ratio profiles from shipborne oceanographic lidar return signals in (a) low, (b) medium and (c) high scattering layer
    Fig. 6. Depolarization ratio profiles from shipborne oceanographic lidar return signals in (a) low, (b) medium and (c) high scattering layer
    Single scattering ratio profiles of simulated shipborne oceanographic lidar return signals in (a) low, (b) medium and (c) high scattering layer
    Fig. 7. Single scattering ratio profiles of simulated shipborne oceanographic lidar return signals in (a) low, (b) medium and (c) high scattering layer
    Relationship between relative errors of depolarization ratio and single scattering ratios
    Fig. 8. Relationship between relative errors of depolarization ratio and single scattering ratios
    Relationship between single scattering ratio and field of view (a) above, (b) in and (c) below the scattering layer
    Fig. 9. Relationship between single scattering ratio and field of view (a) above, (b) in and (c) below the scattering layer
    Relationship between relative errors of depolarization ratio and field of view (a) above, (b) in and (c) below the scattering layer
    Fig. 10. Relationship between relative errors of depolarization ratio and field of view (a) above, (b) in and (c) below the scattering layer
    ParametersValue
    Laser wavelength/nm532
    Telescope diameter/m0.3
    Field of view/mrad10, 20, 50, 100, 200, 500, 1000
    Platform height/m5
    Phase functionPetzold
    Transmission photon counts107
    Maximum scattering times20
    Profile resolution/m0.1
    Table 1. Parameters for simulation of shipborne oceanographic lidar
    Ke Li, Bingyi Liu, Qian Yang, Junwu Tang, Songhua Wu. Simulation of polarization profiles of water measured by oceanographic lidar[J]. Infrared and Laser Engineering, 2021, 50(6): 20211035
    Download Citation