• Laser & Optoelectronics Progress
  • Vol. 57, Issue 8, 083001 (2020)
Hongjuan Meng, Ping Chen*, Jinxiao Pan, and Yihong Li
Author Affiliations
  • Shanxi Key Laboratory of Signal Capturing & Processing, School of Science, North University of China, Taiyuan, Shanxi 030051, China
  • show less
    DOI: 10.3788/LOP57.083001 Cite this Article Set citation alerts
    Hongjuan Meng, Ping Chen, Jinxiao Pan, Yihong Li. X-Ray Multi-Spectral CT Imaging Method Based on Subtraction Fusion[J]. Laser & Optoelectronics Progress, 2020, 57(8): 083001 Copy Citation Text show less
    Diagrams of experimental models. (a) Slice of the silicon used in the simulation; (b) model of silicon cylinder
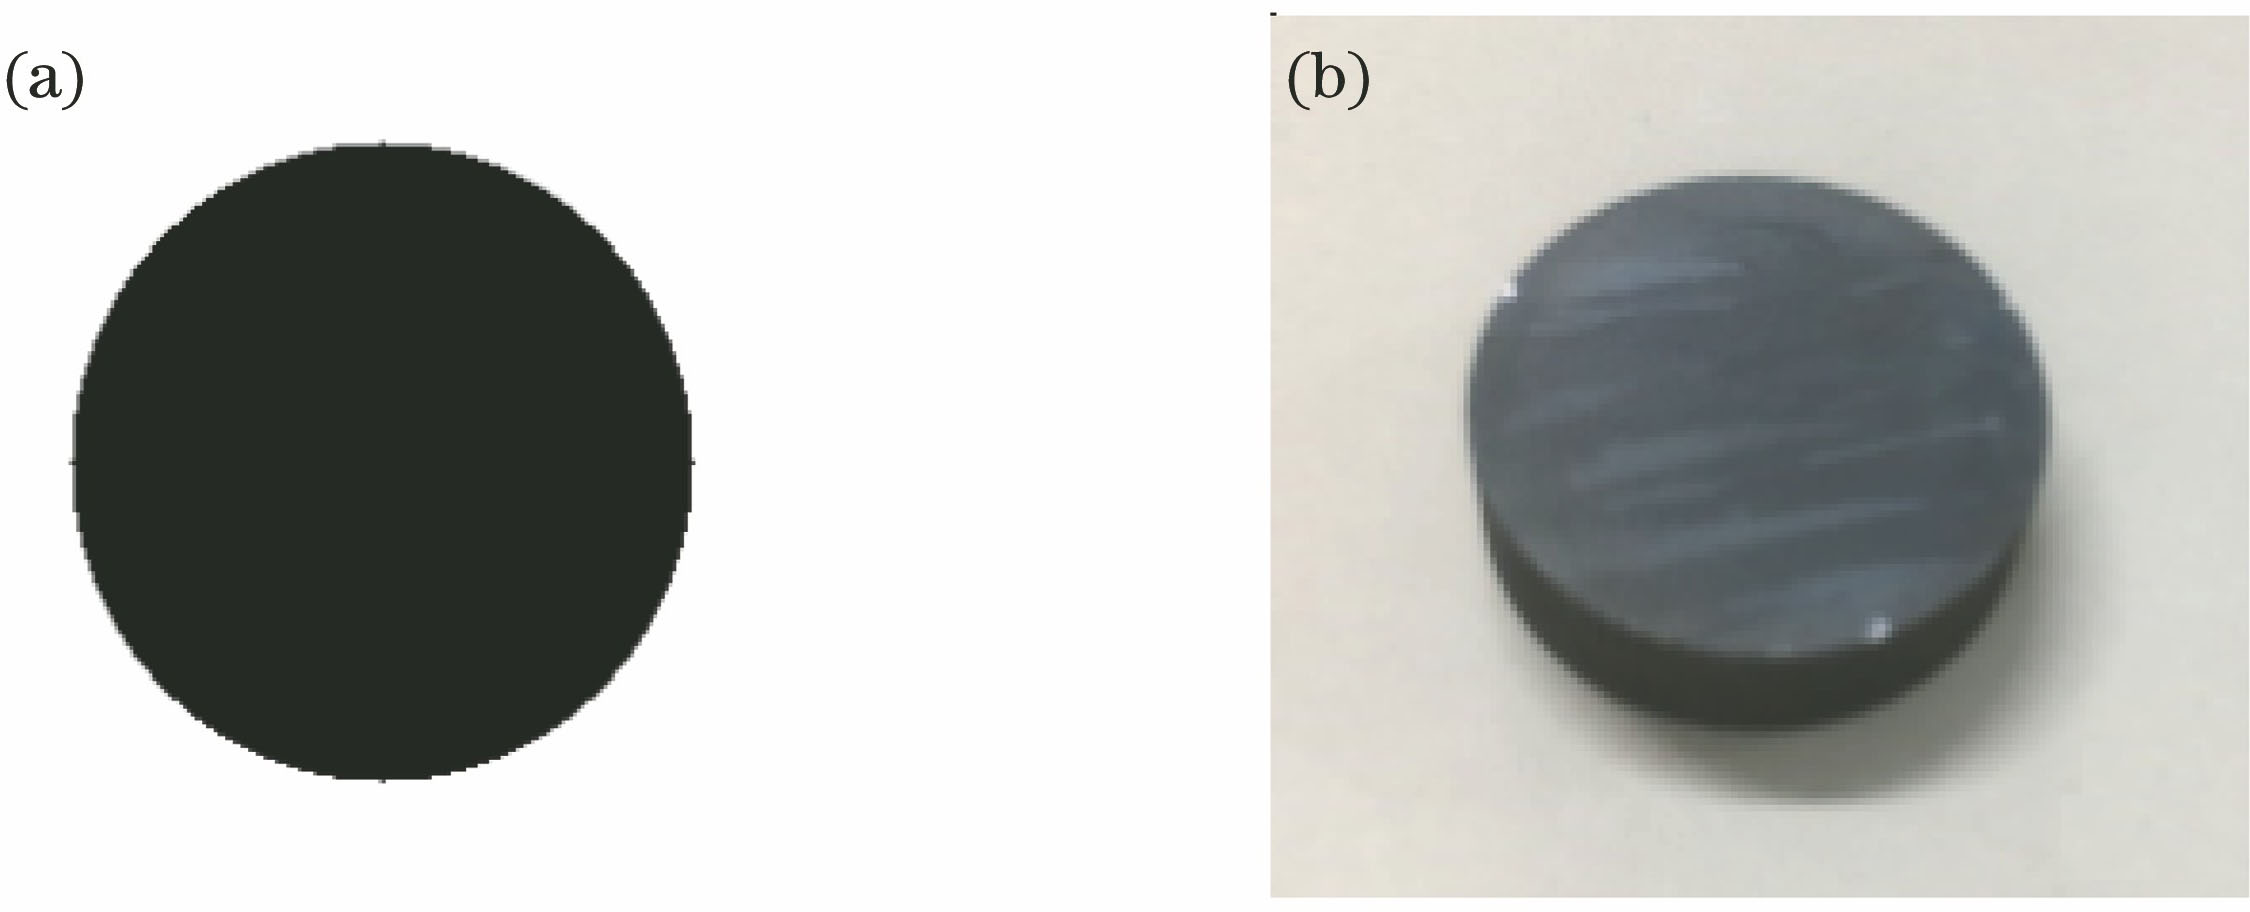
    Fig. 1. Diagrams of experimental models. (a) Slice of the silicon used in the simulation; (b) model of silicon cylinder
    Cures of linear attenuation coefficient
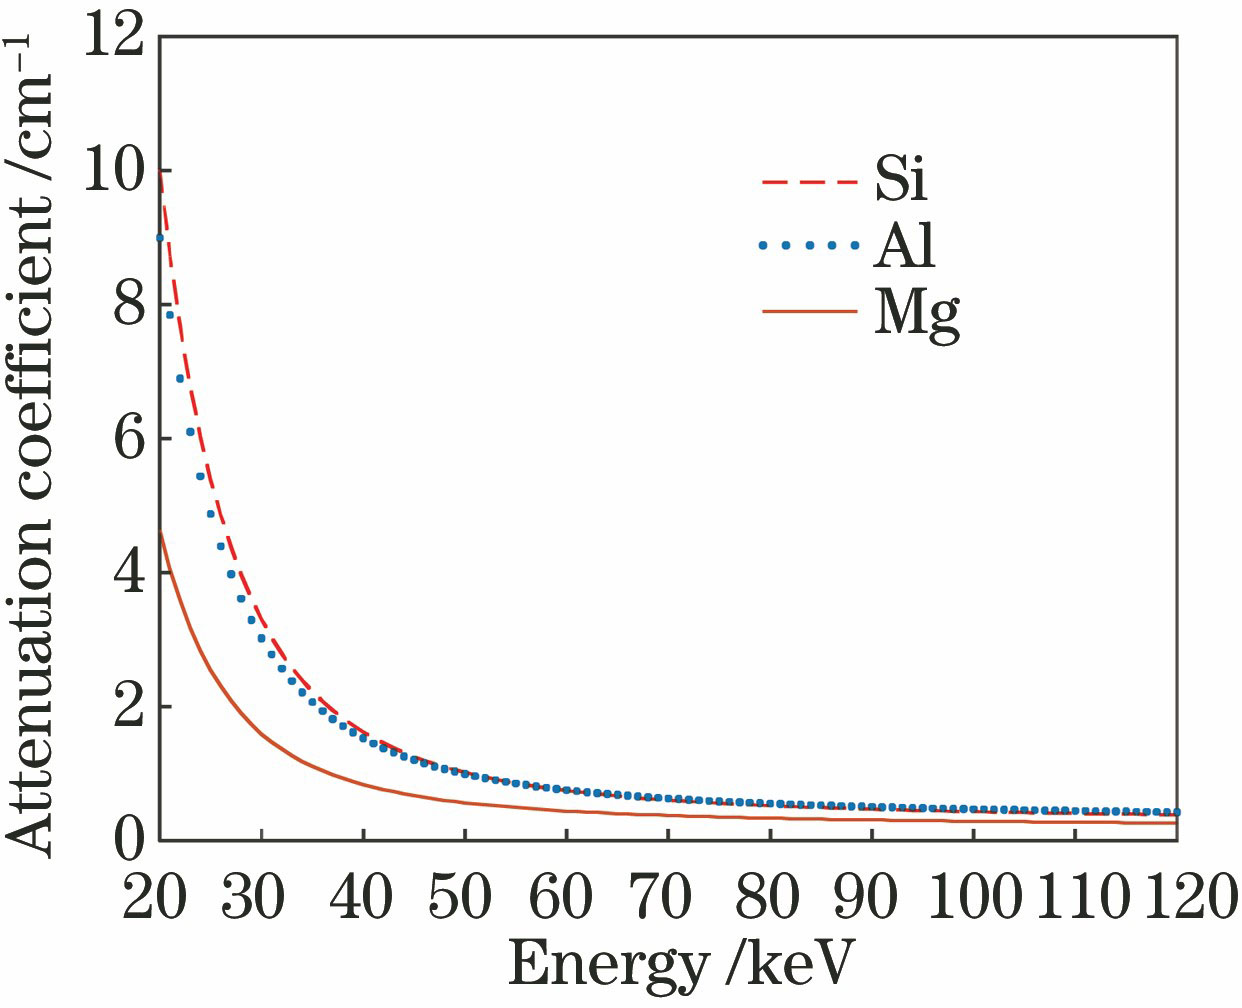
    Fig. 2. Cures of linear attenuation coefficient
    Subtraction fusion results of spectra. (a) Subtraction fusion result of two spectra; (b) subtraction fusion result of three spectra;(c) subtraction fusion result of four spectra
    Fig. 3. Subtraction fusion results of spectra. (a) Subtraction fusion result of two spectra; (b) subtraction fusion result of three spectra;(c) subtraction fusion result of four spectra
    Simulation results of reconstruction images before and after subtraction fusion projection. (a) Image reconstructed with 60 kV polychromatic projection; (b) image reconstructed with 70 kV polychromatic projection; (c) image reconstructed with 90 kV polychromatic projection; (d) image reconstructed with the proposed subtraction fusion projection
    Fig. 4. Simulation results of reconstruction images before and after subtraction fusion projection. (a) Image reconstructed with 60 kV polychromatic projection; (b) image reconstructed with 70 kV polychromatic projection; (c) image reconstructed with 90 kV polychromatic projection; (d) image reconstructed with the proposed subtraction fusion projection
    Curves of gray value of CT reconstruction images at the straight line in Fig. 4
    Fig. 5. Curves of gray value of CT reconstruction images at the straight line in Fig. 4
    Single material experiment results of reconstruction images before and after subtraction fusion projection. (a) Image reconstructed with 60 kV polychromatic projection; (b) image reconstructed with 70 kV polychromatic projection; (c) image reconstructed with 90 kV polychromatic projection; (d) image reconstructed with the proposed subtraction fusion projection
    Fig. 6. Single material experiment results of reconstruction images before and after subtraction fusion projection. (a) Image reconstructed with 60 kV polychromatic projection; (b) image reconstructed with 70 kV polychromatic projection; (c) image reconstructed with 90 kV polychromatic projection; (d) image reconstructed with the proposed subtraction fusion projection
    Curves of gray value of reconstruction images at the straight line in Fig. 6
    Fig. 7. Curves of gray value of reconstruction images at the straight line in Fig. 6
    Multi-material experiment results of reconstruction images before and after subtraction fusion projection. (a) Image reconstructed with 60 kV polychromatic projection; (b) image reconstructed with 70 kV polychromatic projection; (c) image reconstructed with 90 kV polychromatic projection; (d) image reconstructed with the proposed subtraction fusion projection
    Fig. 8. Multi-material experiment results of reconstruction images before and after subtraction fusion projection. (a) Image reconstructed with 60 kV polychromatic projection; (b) image reconstructed with 70 kV polychromatic projection; (c) image reconstructed with 90 kV polychromatic projection; (d) image reconstructed with the proposed subtraction fusion projection
    Curves of gray value of CT reconstruction images at the straight line in Fig. 8
    Fig. 9. Curves of gray value of CT reconstruction images at the straight line in Fig. 8
    Sequence ofprojectionSequence 1Sequence 2Sequence 3
    Voltage /kV607090
    Current /μA1009070
    Exposure time /ms909714526
    Table 1. Scanning parameters of voltage, current, and exposure time
    Hongjuan Meng, Ping Chen, Jinxiao Pan, Yihong Li. X-Ray Multi-Spectral CT Imaging Method Based on Subtraction Fusion[J]. Laser & Optoelectronics Progress, 2020, 57(8): 083001
    Download Citation