
Dan Li, Guojun Bai, Yuanyuan Jin, Yan Tong. Machine-Vision Based Defect Detection Algorithm for Packaging Bags[J]. Laser & Optoelectronics Progress, 2019, 56(9): 091501
- Laser & Optoelectronics Progress
- Vol. 56, Issue 9, 091501 (2019)
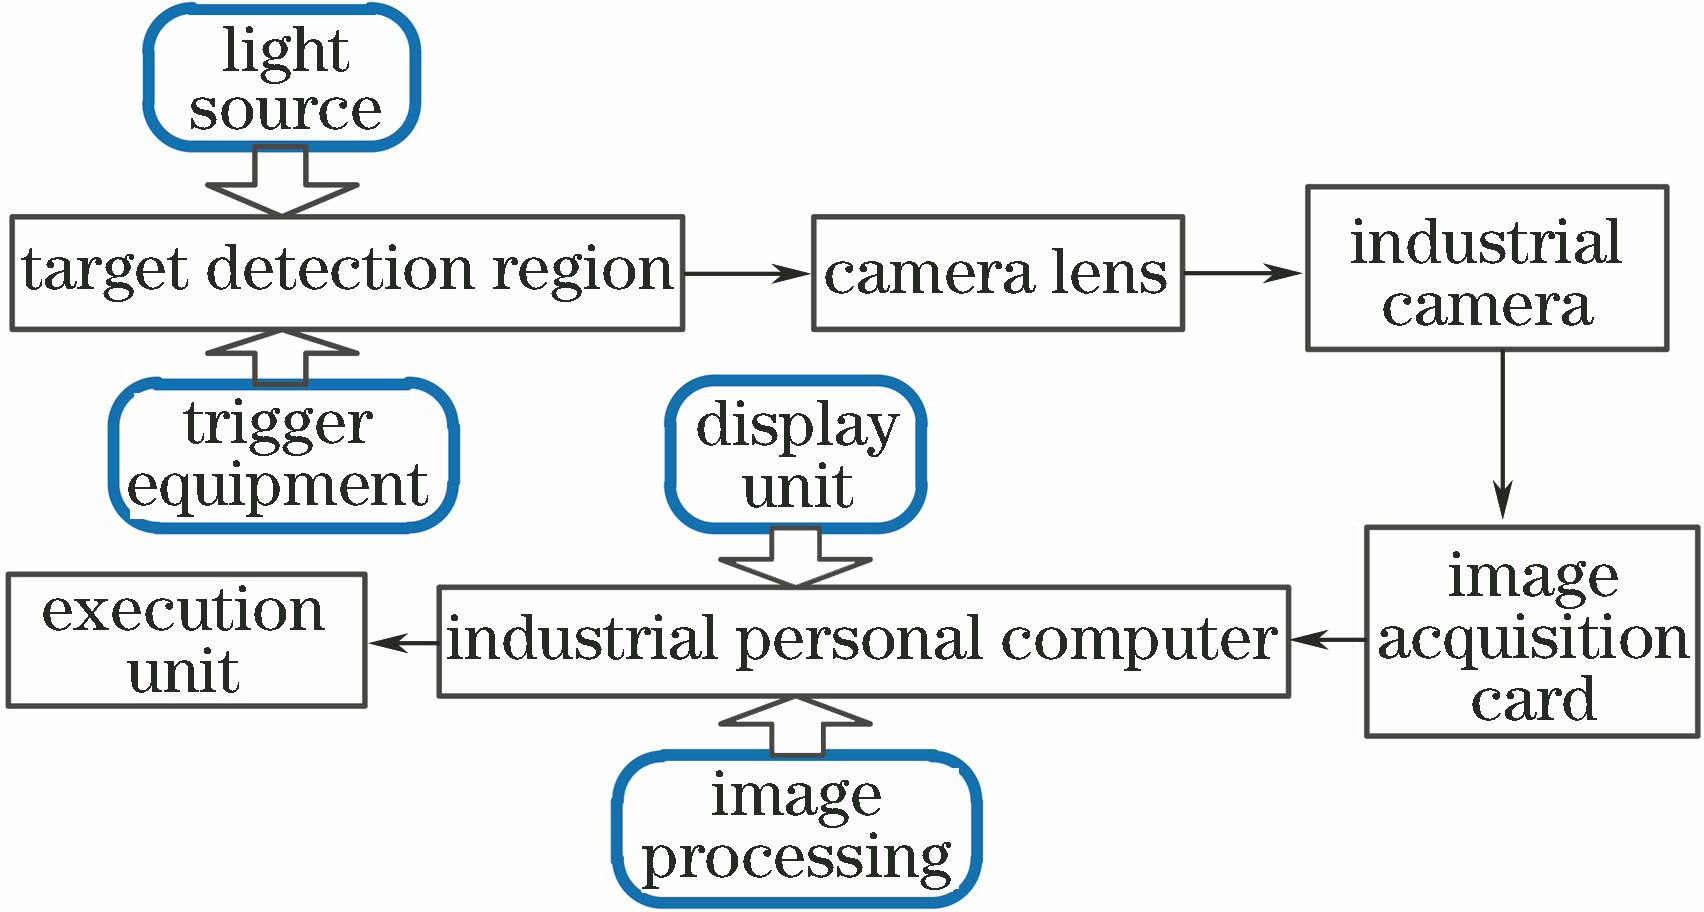
Fig. 1. Architectural diagram of machine-vision based detection system
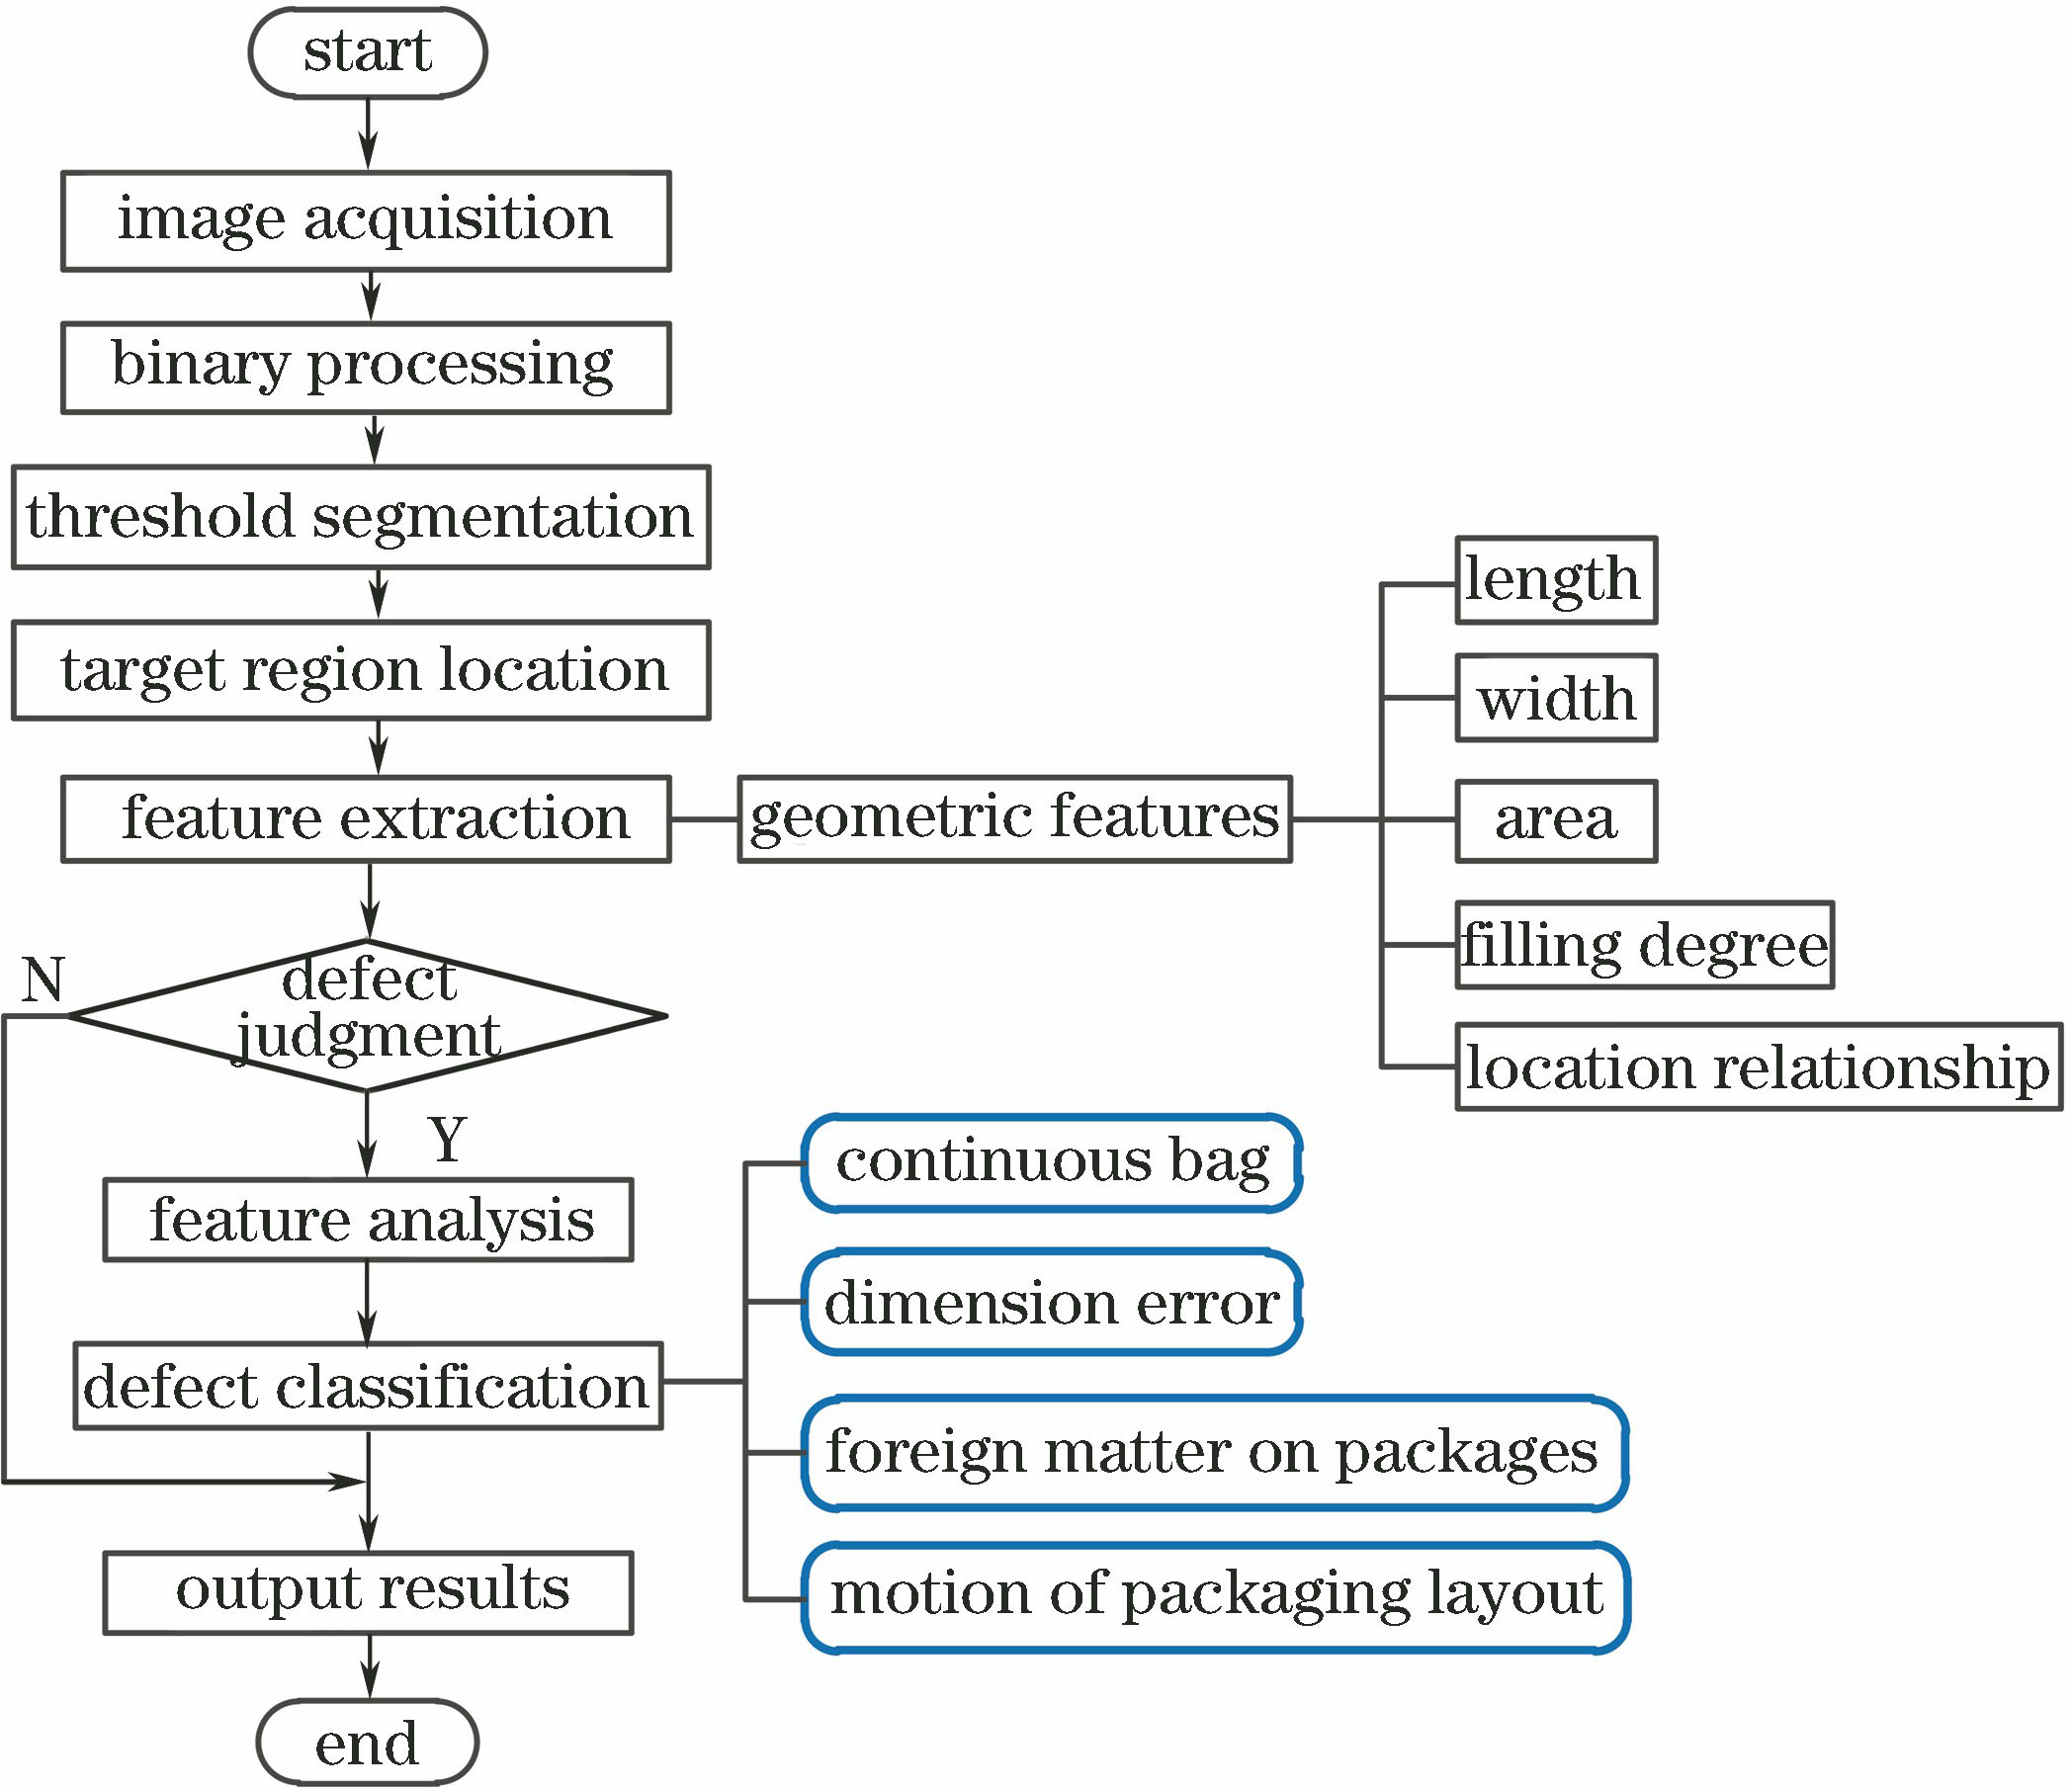
Fig. 2. Flow chart of defect detection algorithm
Fig. 3. Binary images. (a) T1 threshold image; (b) T2 threshold image
Fig. 4. Picture of packing bag
Fig. 5. Platform for experimental testing
Fig. 6. Standard setting module
Fig. 7. Location setting module
Fig. 8. Partial detection results of defect classification. (a) Qualified image; (b) continuous bag (over length); (c) continuous bag (over width); (d) motion of packaging layout; (e) dimension error; (f) foreign matter on packages
|
Table 1. Feature and defect matching
| |||||||||||||
Table 2. Confusion matrix
| |||||||||||||||||||||||||||
Table 3. Confusion matrices for different detection methods
|
Table 4. True positive rates, true negative rates, and accuracy of different detection methods
|
Table 5. Test of classification results

Set citation alerts for the article
Please enter your email address
© Copyright 2018-2021 | Chinese Laser Press. All Rights Reserved 沪ICP备15018463号-20