Xiaojing LIU, Dianfeng LIU, Hongzhuo ZHAO, Jianhua HE, Yaolin LIU. Exploring the spatio-temporal impacts of farmland reforestation on ecological connectivity using circuit theory: A case study in the agro-pastoral ecotone of North China[J]. Journal of Geographical Sciences, 2020, 30(9): 1419
Copy Citation Text
Farmland reforestation can contribute substantially to ecological restoration. Previous studies have extensively examined the ecological effects of farmland reforestation, but few of them have investigated the spatiotemporal responses of broad-scale landscape connectivity to reforestation. By using a typical agro-pastoral ecotone in northern China as a case study, we addressed this issue based on an innovative integration of circuit theory approach and counterfactual analysis. The forest connectivity through multiple dispersal pathways was measured using the circuit theory approach, and its spatiotemporal changes after reforestation were evaluated by counterfactual analysis. The results showed that from 2000-2015, the reforested farmland occupied 2095 km2, and 12.5% was on steeply sloped land. Farmland reforestation caused a greater increase in ecological connectivity by adding new ecological corridors and stepping stones in scattered forest areas rather than in areas with dense forest distributions. The newly added corridors and stepping stones were fragmented, short and narrow and thus deserve powerful protection. Future reforestation to improve landscape connectivity should highlight pinch point protection and obstacle removal as well as the tradeoff between farmland loss and farmer survival. Our findings are expected to inform the optimization of the Grain for Green policy from the perspective of broad-scale biodiversity conservation.
Reforestation of agricultural land is an attractive topic for sustainable development. Its contributions, such as preventing surplus of agricultural products, mitigating farmland abandonment and restoring ecosystems, have been discussed worldwide (García-Feced et al., 2011; Lu et al., 2013; Liu et al., 2019). In China in particular, farmland reforestation has become a critical issue for dealing with the serious ecological degradation caused by long-term extensive agricultural production and widespread deforestation for cultivation (Zhou et al., 2014). In this context, there is still a need to better understand farmland reforestation and its effects.
To date, numerous effects of farmland reforestation have been investigated in practice (e.g., Smith, 2008; Wu et al., 2019). From a socioeconomic perspective, scholars have discussed the relationships of farmland reforestation with minority development (Xie et al., 2018), farmer subsidies and income change (Wang et al., 2004), investment and economic benefits (Long et al., 2006; Bullock and King, 2011), farmer behavior (Chen et al., 2016) and agricultural production and food security (Lu et al., 2013). Furthermore, the ecological effects of farmland reforestation on ecosystem health (Wang et al., 2017), soil quality (Liu et al., 2016; Hui et al., 2018), land degradation mitigation (Hooper et al., 2002; Wang et al., 2012; Yang et al., 2018), and habitat restoration (Lindenmayer et al., 2013) have also attracted increasing attention. However, to coordinate agricultural development and biodiversity conservation, how farmland reforestation affects ecological connectivity still needs to be further investigated.
Ecological connectivity is a key concern in ecosystem conservation. It describes habitat connections and the dispersal probability of species in the landscape (Koen et al., 2014), which can provide helpful guidance for wildlife conservation (Bruinderink et al., 2003), nature reserve selection (Briers, 2002), green infrastructure development (McClure et al., 2016; Carlier and Moran, 2019) and ecological security pattern identification (Zhang et al., 2017; Peng et al., 2019). Therefore, incorporating connectivity analysis will help planners formulate more sustainably reforestation policies. However, previous studies merely detected the relationships between farmland reforestation and spatially implicit improvement of ecological connectivity (García-Feced et al., 2011) but rarely focused on the spatiotemporal changes in ecological connectivity (e.g., ecological sources, corridors and obstacles) after reforestation. Moreover, these studies were merely conducted at the scale of forest districts, but less is known about how ecological connectivity responds to reforestation at broad scales, e.g., the agro-pastoral ecotone.
Ecological connectivity can be measured from structural and functional perspectives, and functional connectivity is more popular because it can represent both physical structures and species behaviors in the landscape. Currently, three categories of methods have been developed to measure ecological connectivity: tracking investigation, landscape index analysis and mathematical simulation. The tracking investigation approach emphasizes field surveys of the migration flows of species. The method is direct and accurate but suffers from a heavy workload and a long duration of implementation (Van Langevelde, 2000). The landscape index includes the network structure index (NSI), the integral index of connectivity (IIC), the probability of connectivity index (PC), and the ecological connectivity index (ECI). This type of method is easy to implement but insufficient to represent the spatial pattern of ecological connectivity (Mimet et al., 2013). Mathematical simulation methods mainly include the least cumulative resistance (LCR) model and circuit theory approach, which are capable of spatially explicit expression of potential functional connectivity based on the limited input data (McRae et al., 2008; Chang et al., 2011). Among these methods, circuit theory is more promising for measuring spatiotemporal changes in ecological connectivity due to its strength in identifying multiple paths and obstacles of species dispersal in the landscape (McRae and Beier, 2007; McRae et al., 2008; Merrick and Koprowski, 2017). Nevertheless, circuit theory has difficulty distinguishing whether the variations in ecological connectivity are caused by reforestation or other land use changes, thus motivating the integration of circuit theory with a land use simulation approach. Counterfactual scenario analysis has been regarded as a feasible simulation method for evaluating the influence of non-observable cases (referred to as counterfactual status that did not happen in reality), such as a scenario without reforestation (Ferraro, 2009; He et al., 2013), and its integration with circuit theory is desirable for assessing the direct connectivity changes induced by reforestation.
In China, farmland reforestation efforts are also known as the “Grain for Green Project”, which stems from the pilot action of vegetation restoration to mitigate soil erosion and soil desertification (Chang et al., 2011). After five stages of development, i.e., the pilot phase (1999-2001), the start-up phase (2002-2003), policy adjustment (2004-2006), the enhancement phase (2007-2014) and the restarting phase (from 2015 to present), farmland reforestation has become an essential strategy of spatial governance and ecological civilization in China. The agro-pastoral ecotone in Inner Mongolia functions as an ecological security barrier connecting the eastern farming areas and the western pastoral areas of northern China. The agricultural land in the ecotone experienced significant reforestation because of the fragility of the ecosystem, and the examination of the corresponding broad-scale changes in ecological connectivity is conducive to the construction of regional ecological security patterns.
For the above reasons, by using an agro-pastoral ecotone in southeastern Inner Mongolia as a case study, this article aims to (1) identify the spatiotemporal changes in ecological connectivity after farmland reforestation; (2) assess the potential improvement in ecological connectivity through reforestation; and (3) optimize reforestation policies from the perspective of biodiversity conservation. To do so, we propose an innovative framework based on the integration of circuit theory and counterfactual scenario analysis. This study is expected to provide an optimization strategy for farmland reforestation to achieve the goal of regional ecological security.
2 Materials and methods
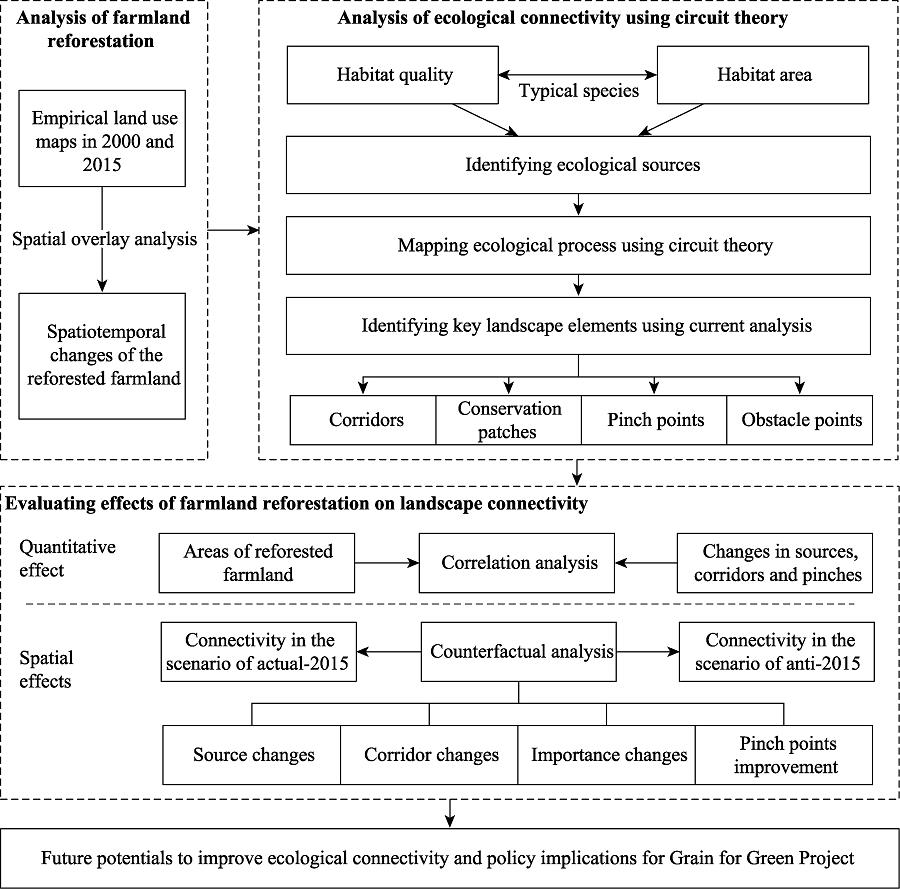
The proposed framework for evaluating the influence of farmland reforestation on broad-scale ecological connectivity consists of three stages (Figure 1). The first identifies reforested farmland based on empirical land use maps at two time points. The second stage evaluates the ecological connectivity of forest patches for typical species using a circuit theory approach and identifies ecological sources, dispersal corridors, pinch points and obstacles in the connectivity network at the same time. The last stage assesses the quantitative and spatial influences of farmland reforestation on landscape connectivity and finds implications for policy makers to promote the Grain for Green policy from the perspective of biodiversity conservation.
Figure 1.
Analysis framework for evaluating the effect of farmland reforestation on ecological connectivity
Chifeng and Tongliao cities of southeastern Inner Mongolia, a typical agro-pastoral ecotone in northern China, were selected as the study area (Figure 2). This region is an important ecological barrier that prevents desertification and ensures the ecological security of the Beijing-Tianjin-Hebei urban agglomertion. It covers 149,556 km2 in total, 33% of which comprises sandy areas. For a long time, unreasonable land use activities, such as large-scale deforestation for grain production and steep slope cultivation, have caused severe soil erosion and desertification. The survival of many national protected animals, e.g., leopards, tigers, sika deer and lynx, has also been affected. Since 2000, a farmland reforestation project has been implemented in the study area, but a better understanding of the relationship between reforestation and landscape connectivity is still lacking.
Figure 2.
Location of the agro-pastoral ecotone of northern China
A series of datasets were used in this research. (1) The empirical land use maps of 2000 and 2015, which indicate the land use status before and after farmland reforestation, were obtained from the Resources and Environment Data Center of the Chinese Academy of Sciences (http://www.resdc.cn/) to identify the reforested farmland. (2) The statistics of the reforested farmland were obtained from the Land Survey and Planning Institute of Inner Mongolia. (3) The elevation and slope were calculated from the GDEMV2 30-meter resolution digital elevation data in the Geospatial Data Cloud (http://www.gscloud.cn/) to identify the sloping farmland. (4) Characteristics of typical species (i.e., sika deer, lynx and red deer), including minimum habitat areas, dispersal distances and threats, were obtained from the China Animal Scientific Database (http://www.zoology.csdb.cn/) to guide the construction of the landscape connectivity networks. All spatial data were reclassified into grids at a spatial resolution of 200 m*200 m using the Nearest Neighbor tool on the ArcGIS platform.
2.2 Analysis of ecological connectivity
2.2.1 Identifying ecological sources
Ecological sources are defined as habitats that support species survival and outward dispersal (Yang et al., 2018). The identification of ecological sources mainly depends on the habitat area, importance of ecosystem services, risk of ecological degradation, habitat suitability and sensitivity, and habitat morphology and quality (Wickham et al., 2010; Wang et al., 2017; Carlier and Moran, 2019). In this study, habitat quality and habitat area were selected for the identification of ecological sources. Habitat quality determines the suitability of landscape patches as species habitats and the level of ecological biodiversity (Xie et al., 2018) and reflects the relationship of habitats and their background environments. It can be calculated as follows:
where Qxj denotes the habitat quality of patch x with land use type j. Hj is the habitat suitability of land use type j. Dxj represents the threat level of movement from land use type j to patch x, which is determined by the threat factors, the distance of threats to x and the habitat sensitivity of each land use type to threats. K is a half-saturation constant, which usually equals half of Dxj. Z is a normalized constant indicating landscape heterogeneity, the value of which is usually fixed to 2.5 (Di Febbraro et al., 2018). The InVEST model was used to calculate the habitat quality, and the parameters of the model, including the maximum influence distances, weights of threat factors and the habitat sensitivity of each land use type to threat factors, were set as shown in Tables 1 and 2 according to the existing studies (Dong et al., 2011; Yan et al., 2018). In this study, the top 30% of the forest patches with high habitat quality were selected as candidate ecological sources.
The required habitat area depends on the characteristics of species, and a large area of ecological sources can better benefit species radiation (Peng et al., 2018). Considering the conservation requirements of multiple species and scattered distribution of forest patches, the minimum area of ecological sources was set at 5 km2 according to the habitat range and dispersal distance of the typical species in this region, such as sika deer, lynx, and red deer (Peng et al., 2017). The ecological source patches were then selected from the candidate set based on the minimum habitat area. The setting of the minimum habitat area in this study will be conductive to modeling landscape connectivity at a broad scale and generating feasible conservation plans for multiple species in an extensive research area.
2.2.2 Analysis of key conservation patches, ecological corridors, pinch points and obstacles
Circuit theory links the dispersal process of species in ecology to the random walk of electrons in physics based on random walk theory and graph theory (McRae et al., 2008). This method interprets ecological networks of habitats as circuits. Specifically, the heterogeneous landscape can be considered as the conductor with effective resistance, the dispersal probability of species in the landscape as the current through the conductor, and the successful dispersal probability as the voltage between the two end points of the conductor. Accordingly, the effective resistance was determined by the resistance distance between the habitats that correlated with the distribution, direction and cover types of the landscape patches.
Based on Ohm’s law, the dispersal probability of species was inversely proportional to the effective resistance of the landscape. In circuit theory, the effective resistance can incorporate multiple pathways between two adjacent nodes (e.g., nodes 1 and 2), and it decreases as the number of branch resistors increases in a parallel circuit. This feature enables us to identify alternative dispersal paths between the landscape patches rather than the unique path with the minimum distance/cost, thus increasing the probability of ecological connectivity.
According to the study of McRae et al. (2008), the current density was adopted to identify important ecological sources, ecological corridors, pinch points and obstacles in the ecological networks of forest patches. Here, the relative resistances of the land use types were adopted to construct the resistance surface for species dispersal rather than the absolute resistance due to the data availability (Theobald, 2005). Based on the existing literature (Schadt et al., 2002; Yin et al., 2011; Peng et al., 2018), the resistance values of forestland and grassland were set to 1, cultivated land to 20, water bodies to 100, unused land to 400, rural residential areas to 450, and urban construction land to 500. Resistance values with high contrasts between different land use types are capable of reducing the sensitivity of the identified dispersal paths to these parameter settings (Rayfield et al., 2010).
Ecological corridors act as green channels that facilitate species dispersal in the landscape and are of great significance for biodiversity conservation. Accordingly, ecological corridors feature lower resistance values, and a larger current passes through these areas in circuit theory. Given an arbitrary pair of forest patches as two ecological sources, e.g., S1 and S2, if the 1A current flows through all effective landscape elements (resistors) between the two sources, then the current density can be calculated based on Ohm’s law. For all pairs of patches, the landscape elements with high cumulative current density can be selected as ecological corridors. The alternative connections between nodes 1 and S1 indicate the strength of circuit theory in identifying multiple dispersal pathways (Figure 3).
Figure 3.
A diagram showing circuit theory for landscape connectivity
Furthermore, the importance of habitat patches in maintaining the overall connectivity can also be evaluated based on the current density (McRae et al., 2008; Carroll et al., 2012). If a habitat patch in an ecological network, such as S2, acts as a key node for the connection of more than two ecological sources, then the current density through this patch will be higher than that through the patches connecting less than two sources. This phenomenon indicates the important role of patch S2 in increasing species richness and biodiversity. In this article, the ecological sources with the top 30% of current density values were identified as key conservation areas.
Pinch points and obstacles indicate the patches in the ecological network that influence the connectivity of ecological corridors if removed or converted. Pinch points refer to the narrow sections of ecological corridors, and their removal may result in the complete disconnection of ecological sources. For example, node 1 can be regarded as a pinch point because its removal would disconnect source patches S1 and S2 (Figure 3). In contrast, obstacle points, such as obstacle 4 and obstacle 5, block the connections between ecological sources (or habitat patches). The removal of these points via reforestation will significantly improve the conductance of landscapes (McRae et al., 2012).
Circuitscape 4.0 and Linkage Mapper 2.0.0 (McRae and Beier, 2007), which are two geographical information system tools based on circuit theory, were employed to construct ecological networks and identify ecological sources, corridors, key conservation areas, pinch points and obstacles (http://www.circuitscape.org).
2.3 Evaluating the effects of farmland reforestation on ecological connectivity
To distinguish the change in ecological connectivity induced by farmland reforestation, two scenarios were defined in the counterfactual analysis: actual-2015 and anti-2015. The actual-2015 scenario exhibited the empirical spatial pattern of land use after reforestation in 2015, and anti-2015 scenario simulated a counterfactual spatial pattern of land use that did not experience the reforestation process during the period 2000-2015. Specifically, the land use patches where reforestation was supposed to be applied would remain as cultivated land, while other land use conversions in the study area occurred as usual in the counterfactual scenario. In the actual and counterfactual scenarios, the ecological connectivity in terms of ecological corridors, key conservation areas, pinch points and obstacles were evaluated and compared using spatial overlay analysis.
3 Results and discussion
3.1 Land use change induced by reforestation
From 2000 to 2015, the area of reforested farmland was 2095 km2, accounting for 15.6% of the net increase in forestland (9263 km2). Of the total reforestated area, 49.8% came from farmland on a slope of 5°-15°, and 8.7% came from farmland on a slope greater than 15°. The reforested farmland accounted for 22.5% of the total farmland loss over 15 years, or 12.5% of the total sloping farmland in 2000. Fortunately, the total amount of farmland did not decrease because of the reforestation during the period 2000-2015 but instead increased by 2545 km2.
The reforested areas were mainly scattered in the eastern and southeastern counties, which suffered from smaller forest distributions, fragile ecosystems and serious soil desertification (Figure 4). Among these counties, Aohan had the largest reforestated area of 320.98 km2, and Kailu had the greatest reforestation rate of 16.66%. In contrast, the northern and northwestern counties, which had significant topographic fluctuations, had sparse conversion of farmland to forest and less reforested areas (Figure 4b).
Figure 4.
Reforested farmland during the period 2000-2015 (a. spatial pattern; b. reforested area and reforestation rate in each county)
3.2 Spatiotemporal changes in ecological connectivity
3.2.1 Ecological sources and key conservation areas
Significant expansion of the ecological sources was observed during the period 2000-2015, with an increase rate of 112.6%. In the spatial pattern (Figures 5a and 5b), the majority of the expansion occurred in the western fringe of the study area, which further improved the stability and penetration (i.e., high current density) of the source patches. For the eastern and central regions, a number of small-sized forest patches with high currents were newly added as ecological sources, which could provide additional alternative habitats for forest species.
The importance of ecological sources was classified into three levels: the first had current density values in the top 10%, the second had current density values in the top 10%-20% and the third had current density values in the top 20%-30% (Figures 5c and 5d). From 2000 to 2015, the number of the first- and third-level patches remained unchanged, while the proportion of the second-level patches increased by 8.7%. Meanwhile, the total area of the first-, second-, and third-level patches increased by 75.3%, 88.7%, and 22.6%, respectively. The important changes in the ecological sources in the north and the west mainly relied on spatial expansion of the first-level patches and their combination with low-level patches. The first-level patches in the north were mainly large-scale ecological sources that supported species survival, while those in the west may function as stepping stones for the north-south connection of ecological sources. In addition, key conservation areas should also consider the patches that are irreplaceable for landscape connectivity, for example, the newly developed ecological sources of the third-level importance in the east.
Figure 5.
Spatial distribution of ecological sources and key conservation areas (a and b. sources in 2000 and 2015; c and d. key areas in 2000 and 2015)
Spatial pattern of ecological corridors and obstacles (a and b. corridors in 2000 and 2015; c and d. obstacles and the occupation of land use types in 2015)
3.2.2 Ecological corridors, pinch points and obstacles
From 2000 to 2015, the ecological corridors became longer and wider in the west due to the expansion and consolidation of the ecological sources (Figures 6a and 6b). In the south, extensive new corridors simultaneously emerged to promote the east-west connectivity of ecological sources. In the east, however, only a small number of short and narrow corridors grew out of nothing near the existing ecological sources, which might not effectively mitigate the isolation of forest habitats. A total of 598 obstacle points for ecological connectivity were identified, 43.6% of which were smaller than 10 ha in area (Figure 6c). These obstacles were mainly occupied by cultivated land, rural settlements and sandy areas (cultivated land: 67.86%, 10% of which was on a slope greater than 15°; rural settlements: 5.51%; and sandy areas: 10.41%).
In 2000, the pinch points were mostly distributed in the northwest, and no pinch point existed in the east. In 2015, the pinch points increased significantly with the development of ecological corridors (Figure 7). In the northwest, most of the pinch points were encroached by the expansion of ecological sources. In the south and east, however, a number of pinch points were newly added to the corridors due to severe desertification and farmland protection. The existence of pinch points in these areas indicated fragile ecological connections and insufficient dispersal pathways for species.
Figure 7.
Spatial distribution of pinch points (a. 2000; b. 2015)
3.3 Effects of farmland reforestation on ecological connectivity
The quantitative effects of reforestation on ecological sources, corridors and pinch points in different counties are presented in Table 3. Overall, the reforestation policy has mostly caused an increase in ecological sources. A total of 341.55 km2 of reforested areas have become new ecological sources, followed by 99.43 km2 of new corridors and 5.01 km2 of new pinch points. After reforestation, the northern and western counties experienced the greatest increase in ecological sources, while those in the south and middle had the greatest increase in ecological corridors and pinch points. According to Pearson correlation analysis, the reforested areas exhibited positive correlations with the increase in corridors and pinch points (r=0.612, 0.609, p≤0.005) but no significant correlation with the increase in ecological sources (Figure 8). The ecological connectivity was more likely to be improved in the form of ecological corridors and/or pinch points in largely reforested counties. For example, some eastern and southern counties without an increase in ecological sources still showed improved connectivity after reforestation.
Counties
Reforested area
Source increase
Corridor increase
Pinch increase
Aohan
320.98
23.91
29.71
1.65
Horqin-Zuoyizhong
225.45
0.00
0.64
0.00
Naiman
187.31
5.36
4.09
0.14
Horqin-Zuoyihou
157.29
0.01
0.66
0.09
Kulun
153.14
0.00
4.43
0.72
Zhalute
141.31
72.13
1.05
0.14
Keshiketeng
132.20
70.88
8.50
0.01
Wengniute
131.33
18.84
17.02
0.46
Songshan
117.12
28.49
16.04
1.17
Balinzuo
83.49
30.20
1.61
0.00
Kailu
78.92
4.12
0.27
0.26
Horqin
72.94
0.00
0.36
0.00
Alukerqin
68.38
18.32
2.30
0.01
Kalaqin
59.64
27.59
1.56
0.06
Ning County
57.91
6.00
1.01
0.07
Linxi
41.29
20.58
7.02
0.02
Balinyou
40.44
13.66
1.44
0.00
Yuanbaoshan
17.66
1.46
1.59
0.21
Hongshan
7.46
0.00
0.13
0.00
Holingol
0.14
0.00
0.00
0.00
Table 3.
Changes in ecological connectivity after reforestation in different counties (km2)
The comparison of the anti-2015 and actual-2015 scenarios showed that the reforestation caused the ecological sources to increase in area by 445.00 km2 but caused a decrease in the patch number and fragmentation. The enlargement and consolidation of ecological sources induced by the reforestation was dominant in the northwestern regions where forestland was densely distributed, while a handful of small, isolated forest patches were generated in the south and middle as stepping stones or corridors for the east-west dispersal of species. In the east, a large area of farmland was reforested to form corridors but exerted only a slight influence on the ecological connectivity due to the extremely sparse distribution of ecological sources and the fragmented, short and narrow characteristics of the new corridors.
Furthermore, the counterfactual analysis suggested the significant effects of farmland reforestation on the importance of forest habitats. Due to the reforestation policy, the importance of 8.83% of the forest patches (Type II) was upgraded from the third- to the second-level and that of 2.18% of the forest patches (Type IV) that were small in size (12 km2 in maximum) grew at turning points or endpoints of the newly added corridors in the central and eastern regions. In addition, farmland reforestation caused an important decline in and loss of forest patches surrounded by sandy grassland and barren areas (Types III and V, accounting for 8.33% in total). It is also noteworthy that reforestation did not affect the importance of 80.65% of the patches (Type I) that were densely distributed and large in size in the west (Figure 9).
Figure 9.
Comparison of the actual and counterfactual scenarios in terms of ecological sources, corridors, pinch points and patch importance (Type I: unchanged importance; Type II: upgraded importance; Type III: downgraded importance; Type IV: gain of important patches; and Type V: loss of important patches)
From 2000 to 2015, the reforestation of agricultural land caused remarkable changes in forestland and farmland. Reforestation increased the area of forestland and effectively mitigated the forest loss induced by the development of the forestry economy. Meanwhile, reforestation also decreased the sloping farmland that suffered from soil erosion and/or ecological degradation but did not weaken the effectiveness of farmland protection. A series of land use policies, e.g., the reclamation of abandoned land for cultivation, has been proven feasible to supplement farmland loss after reforestation and to ensure the net growth in cultivated areas. However, it should also be noted that a strictly positive correlation, as suggested by the existing studies, did not exist between farmland reforestation and steep slopes in this case (Long et al., 2006; Bullock and King, 2011; Delang and Wang, 2013). The scarce cultivated land in the northern and northwestern counties strengthened their relative importance in agricultural production to maintain farmer survival, which may hinder the implementation of the Grain for Green Project in practice. In contrast, some farmland on the small slope in the east was still reforested due to land degradation. Our findings suggest that reforestation measures should be adjusted to local conditions in the agro-pastoral ecotone.
In this study, farmland reforestation substantially improved the overall landscape connectivity at the broad scale in the form of ecological corridors and/or stepping stones. Excessively sparse/dense distributions of forest patches reduce the effect of reforestation due to the positive correlation of landscape connectivity with the number of ecological sources but the negative correlation with the proximity of ecological sources (Avon and Bergès, 2016; Xu et al., 2015). As shown in Figure 9, the number of new ecological sources after reforestation may not affect landscape connectivity. Instead, greater attention should be paid to the conservation of new corridors and stepping stones, and alternative dispersal pathways should be developed to reduce the pinch points. At the patch scale, reforestation was capable of upgrading the importance levels of 8.83% of forest patches. However, we should also notice that reforestation may generate high levels of ecological sources around patches of Types III and V, which can provide more appropriate choices for species dispersal and cause the de-functionalization of small and fragmented patches (Hodgson et al., 2016; Crist et al., 2017).
From the ecological conservation perspective, the future potential implementation of the Grain for Green Project should highlight the protection of pinch points and the removal of obstacle points. The pinch points should be strengthened to protect the connection of ecological sources from human disturbances (Dutta et al., 2016; Hodgson et al., 2016). In this case, the sloping farmland around the pinch points should be prioritized for reforestation to add alternative corridors/stepping stones for species dispersal. Meanwhile, ecological networks of forestland can be further promoted due to the small sizes of obstacles. The reforestation of sloping farmland at obstacles can be used as a powerful restoration measure (McRae et al., 2012; Liu et al., 2018), and the consolidation of rural settlements and restoration of vegetation in sandy areas at obstacles will also be feasible for improving connectivity (Lechner et al., 2015). Meanwhile, a tradeoff should be emphasized between farmland loss and farmer survival.
Circuit theory can integrate structural and functional connectivity to represent the dispersal probabilities of species and identify all potential corridors of species dispersal rather than the unique minimum cumulative cost paths. The integration of circuit theory and counterfactual analysis was feasible to evaluate how reforestation affected ecological connectivity and provided guidance for ecological restoration based on multiple scenarios. However, this study only evaluated the changes in ecological connectivity by comparing two point-in-time snapshots of landscapes while neglecting the temporal interactions of the forest patches (Martensen et al., 2017). Future works will focus on the creation of spatiotemporal ecological networks and on examining their responses to the reforestation policy.
4 Conclusions
Farmland reforestation is an essential ecological restoration measure for the development of ecological civilization in China. Based on circuit theory and the counterfactual scenario analysis approach, this article examined how the reforestation process affected the ecological connectivity of forest habitats in terms of ecological sources, corridors and obstacle points during the period 2000-2015 in the agro-pastoral ecotone of southeastern Inner Mongolia. In contrast to previous studies, this study identified the spatiotemporal changes in landscape connectivity at a broad scale after reforestation and provided solid support for optimization of the policy of returning farmland to forestland from the perspective of biodiversity conservation.
The results showed that the conversion of farmland to forest in the study area was 2095 km2, which was notable and heterogeneous in spatial distribution. This conversion mitigated forest loss but did not cause a significant decrease in cultivated land due to the contemporaneous policy of land reclamation. The reforestation efforts improved ecological connectivity in different ways. In the northern and western regions, which had high habitat quality and high forest cover, the reforestation policy led to an increase in the ecological sources through the expansion and consolidation of forest patches. In the southern and central regions, which had scattered forest distributions, the policy generated a large number of east-west corridors or stepping stones between the ecological sources and upgraded their importance levels. In comparison, the contribution of the Grain for Green Project to the promotion of landscape connectivity was more significant in the southern and central regions than in the northern and western. However, the ecological connectivity in the southern and central deserves better protection because the newly developed corridors are fragmented, short and narrow. Our results suggested that the future potential of farmland reforestation depends on the protection of pinch points and the removal of obstacle points, as well as the balance of farmland loss and farmer survival.
[3] et alDesigning a coherent ecological network for large mammals in northwestern Europe. Conservation Biology, 17, 549-557(2003).
[4] Evaluating China’s Slope Land Conversion Program as sustainable management in Tianquan and Wuqi Counties. Journal of Environmental Management, 98, 1916-1922(2011).
[7] et alUrban landscape pattern design from the viewpoint of networks: A case study of Changzhou city in Southeast China. Ecological Complexity, 8, 51-59(2011).
[11] et alExpert-based and correlative models to map habitat quality: Which gives better support to conservation planning?. Global Ecology and Conservation, 16, 13-26(2018).
[12] et alSpatio-temporal pattern and rationality of land reclamation and cropland abandonment in mid-eastern Inner Mongolia of China in 1990-2005. Environmental Monitoring and Assessment, 179, 137-153(2011).
[14] Improving landscape connectivity in forest districts: A two-stage process for prioritizing agricultural patches for reforestation. Forest Ecology and Management, 261, 154-161(2011).
[15] et alA counterfactual scenario simulation approach for assessing the impact of farmland preservation policies on urban sprawl and food security in a major grain-producing area of China. Applied Geography, 37, 127-138(2013).
[17] Responses of 20 native tree species to reforestation strategies for abandoned farmland in Panama. Ecological Applications, 12, 1626-1641(2002).
[18] et alOver twenty years farmland reforestation decreases fungal diversity of soils, but stimulates the return of ectomycorrhizal fungal communities. Plant and Soil, 427, 231-244(2018).
[19] et alLandscape connectivity for wildlife: Development and validation of multispecies linkage maps. Methods in Ecology and Evolution, 5, 626-633(2014).
[22] et alStructure optimization of circuit theory-based green infrastructure in Nanjing, China. Acta Ecologica Sinica, 28, 4363-4372(2018).
[23] et alBacterial community structure in atrazine treated reforested farmland in Wuying China. Applied Soil Ecology, 98, 39-46(2016).
[24] Spatio-temporal characteristics of soil protection efforts of the Grain for Green Project in northern Shaanxi Province. Journal of Geographical Sciences, 30, 401-422(2019).
[28] Spatio-temporal connectivity: Assessing the amount of reachable habitat in dynamic landscapes. Methods in Ecology and Evolution, 8, 1253-1264(2017).
[32] et alWhere to restore ecological connectivity? Detecting barriers and quantifying restoration benefits. PLoS ONE,, 7, e52604(2012).
[33] Circuit theory to estimate natal dispersal routes and functional landscape connectivity for an endangered small mammal. Landscape Ecology, 32, 1163-1179(2017).
[51] et alDeveloping ecological networks based on MSPA and the least-cost path method: A case study in Bazhong western new district. Acta Ecologica Sinica, 35, 6425-6434(2015).
Xiaojing LIU, Dianfeng LIU, Hongzhuo ZHAO, Jianhua HE, Yaolin LIU. Exploring the spatio-temporal impacts of farmland reforestation on ecological connectivity using circuit theory: A case study in the agro-pastoral ecotone of North China[J]. Journal of Geographical Sciences, 2020, 30(9): 1419