• Photonics Research
  • Vol. 8, Issue 5, 659 (2020)
Luis Romero Cortés*, Reza Maram, and José Azaña
Author Affiliations
  • Institut National de la Recherche Scientifique–Énergie, Matériaux et Télécommunications (INRS–EMT), H5A 1K6 Montréal, Quebec, Canada
  • show less
    DOI: 10.1364/PRJ.375990 Cite this Article Set citation alerts
    Luis Romero Cortés, Reza Maram, José Azaña. Fully reversible spectral compression of arbitrary pulsed data signals[J]. Photonics Research, 2020, 8(5): 659 Copy Citation Text show less
    (a) Illustration of the proposed concept for waveform-preserving spectral compression of data-modulated short-pulse sequences. This is achieved through a suitable combination of reversible phase-only linear transformations (GVD, second-order group-velocity dispersion; PM, quadratic temporal phase modulation). Such phase transformations produce the desired spectral compression while maintaining the original individual pulse shape: the overall spectral width remains unchanged, but periodic frequency gaps (with no remaining signal energy) are introduced in the spectrum, reducing the effective occupied bandwidth. The original data-modulated waveform can be fully recovered through application of the inverted phase transformations (−GVD, −PM). (b) Example of a potential use of the proposed spectral compression process in a data signal communication (or processing) system. The data signal is transmitted through the system following spectral compression by reversible linear transformations, thus utilizing a lower bandwidth of the transmission medium. At the output of the communication link, following compensation of all transmission impairments undergone by the propagating signal, the inverted transformations are applied on the received signal, restoring the data waveform to its exact original state.
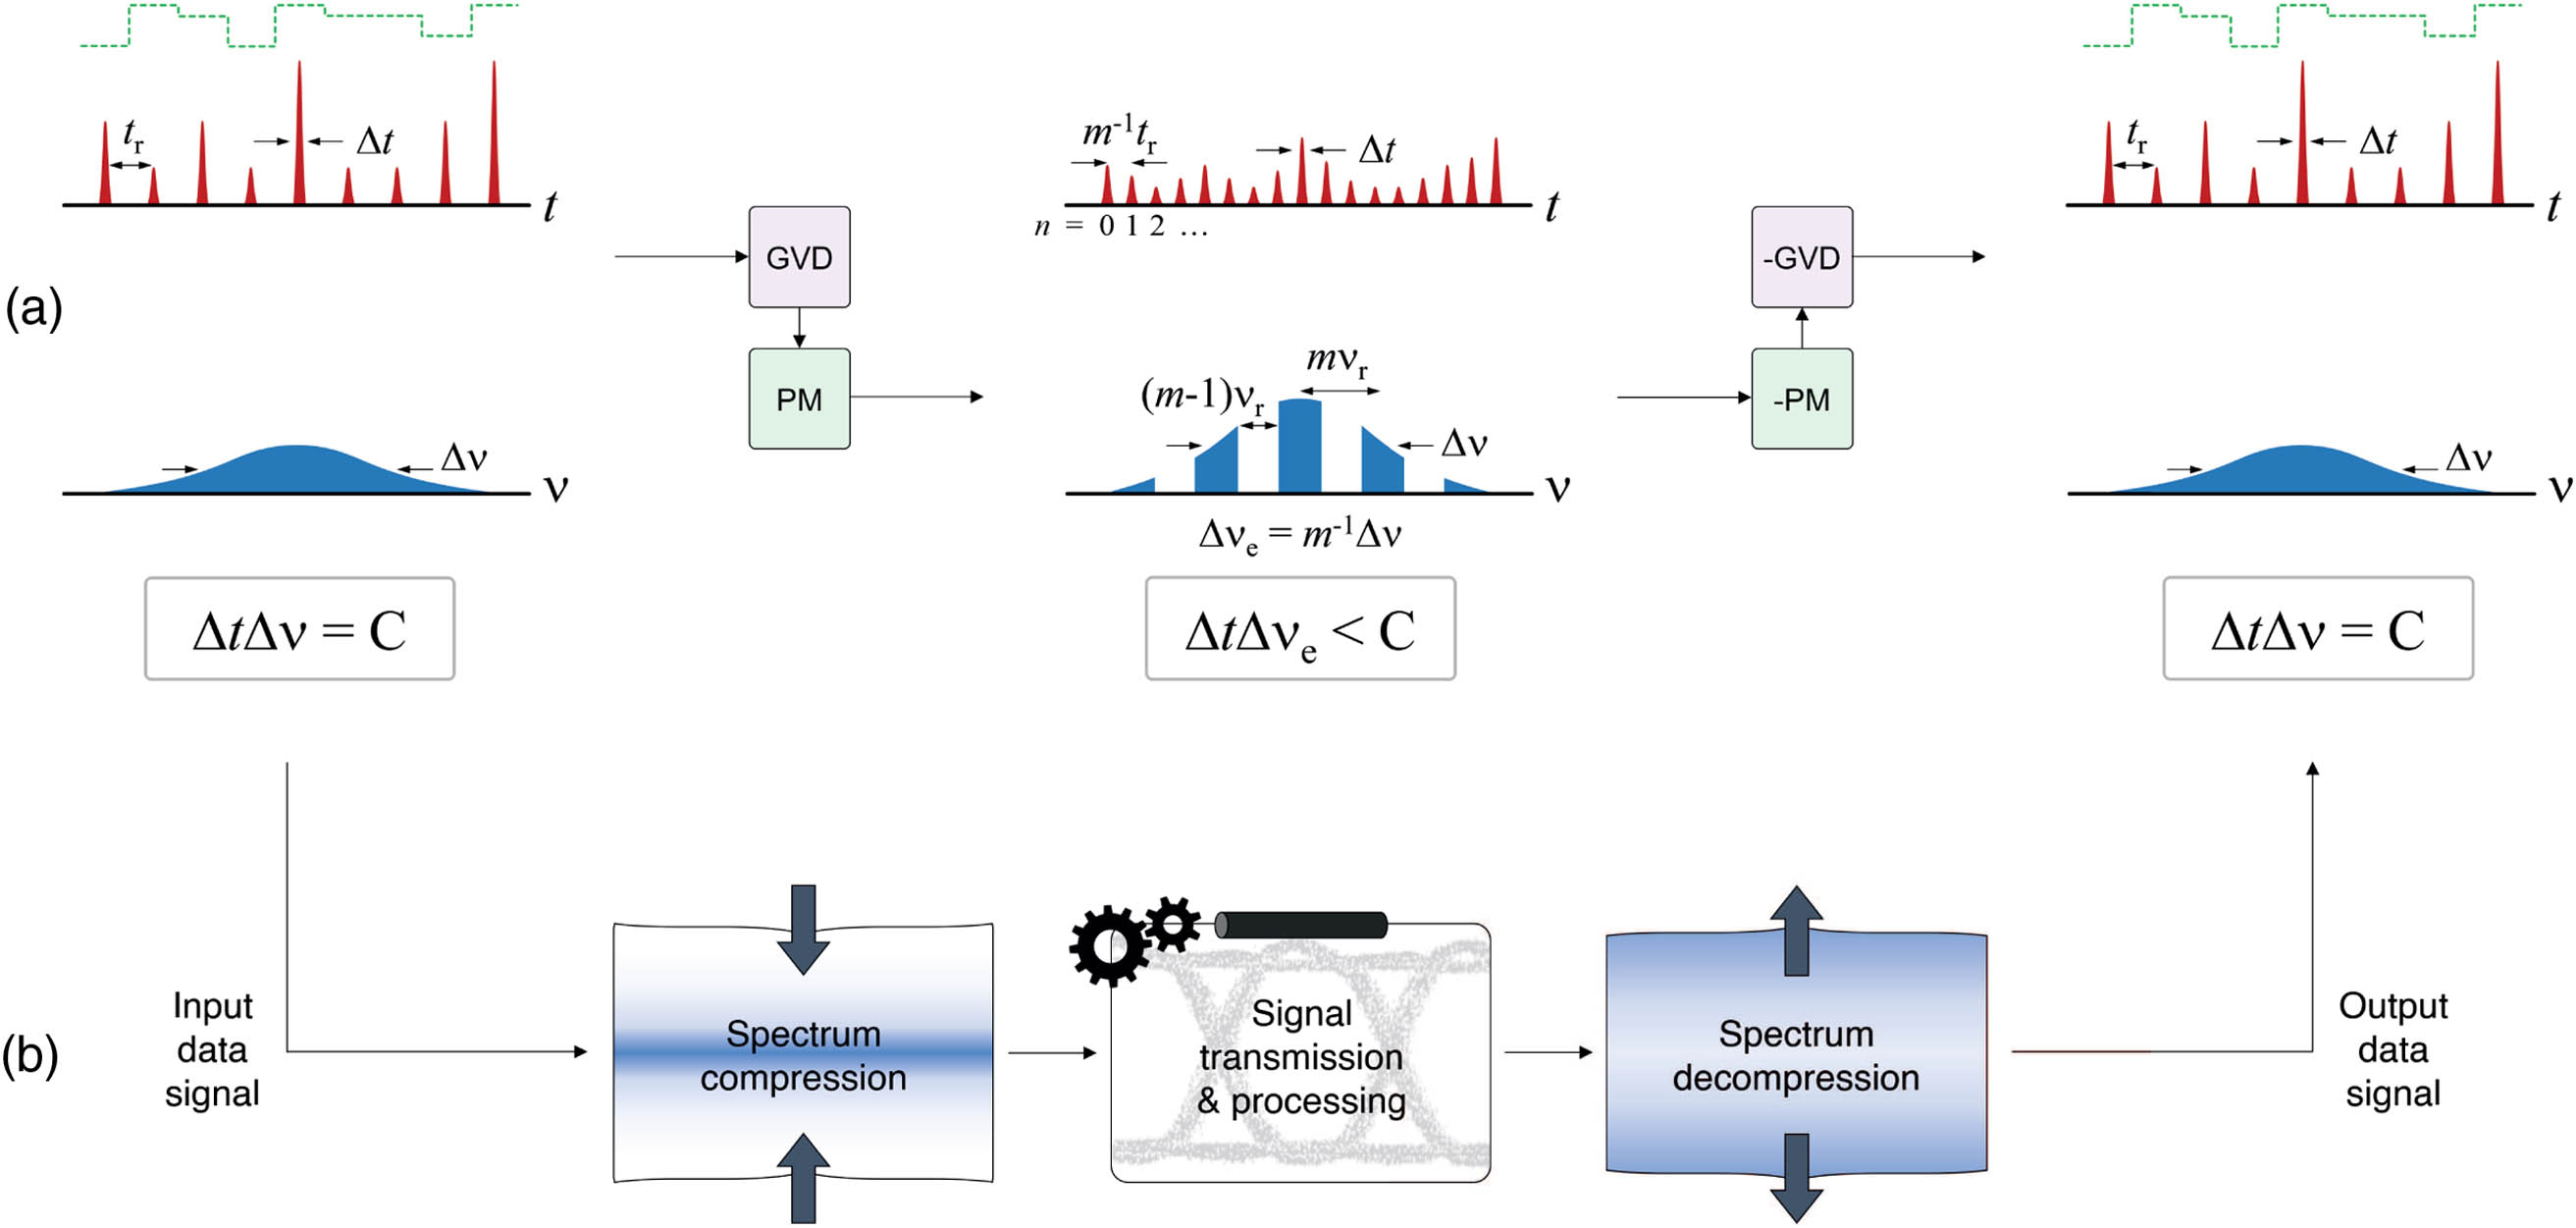
    Fig. 1. (a) Illustration of the proposed concept for waveform-preserving spectral compression of data-modulated short-pulse sequences. This is achieved through a suitable combination of reversible phase-only linear transformations (GVD, second-order group-velocity dispersion; PM, quadratic temporal phase modulation). Such phase transformations produce the desired spectral compression while maintaining the original individual pulse shape: the overall spectral width remains unchanged, but periodic frequency gaps (with no remaining signal energy) are introduced in the spectrum, reducing the effective occupied bandwidth. The original data-modulated waveform can be fully recovered through application of the inverted phase transformations (−GVD, −PM). (b) Example of a potential use of the proposed spectral compression process in a data signal communication (or processing) system. The data signal is transmitted through the system following spectral compression by reversible linear transformations, thus utilizing a lower bandwidth of the transmission medium. At the output of the communication link, following compensation of all transmission impairments undergone by the propagating signal, the inverted transformations are applied on the received signal, restoring the data waveform to its exact original state.
    Reversible wave transformations for waveform-preserving spectral compression. Summary of the steps involved in the spectral compression process, including phase-only manipulations along the time and frequency domains for (a) a periodic sequence of short pulses, corresponding to a frequency comb (discrete broadband frequency spectrum), shown here to explain the proposed concept, and (b) a modulated sequence of short pulses (continuous broadband frequency spectrum), showing waveform-preserving spectral compression. See main text for parameter definitions; PM and GVD stand for temporal phase modulation and group-velocity dispersion, respectively; t holds for time and ν holds for frequency.
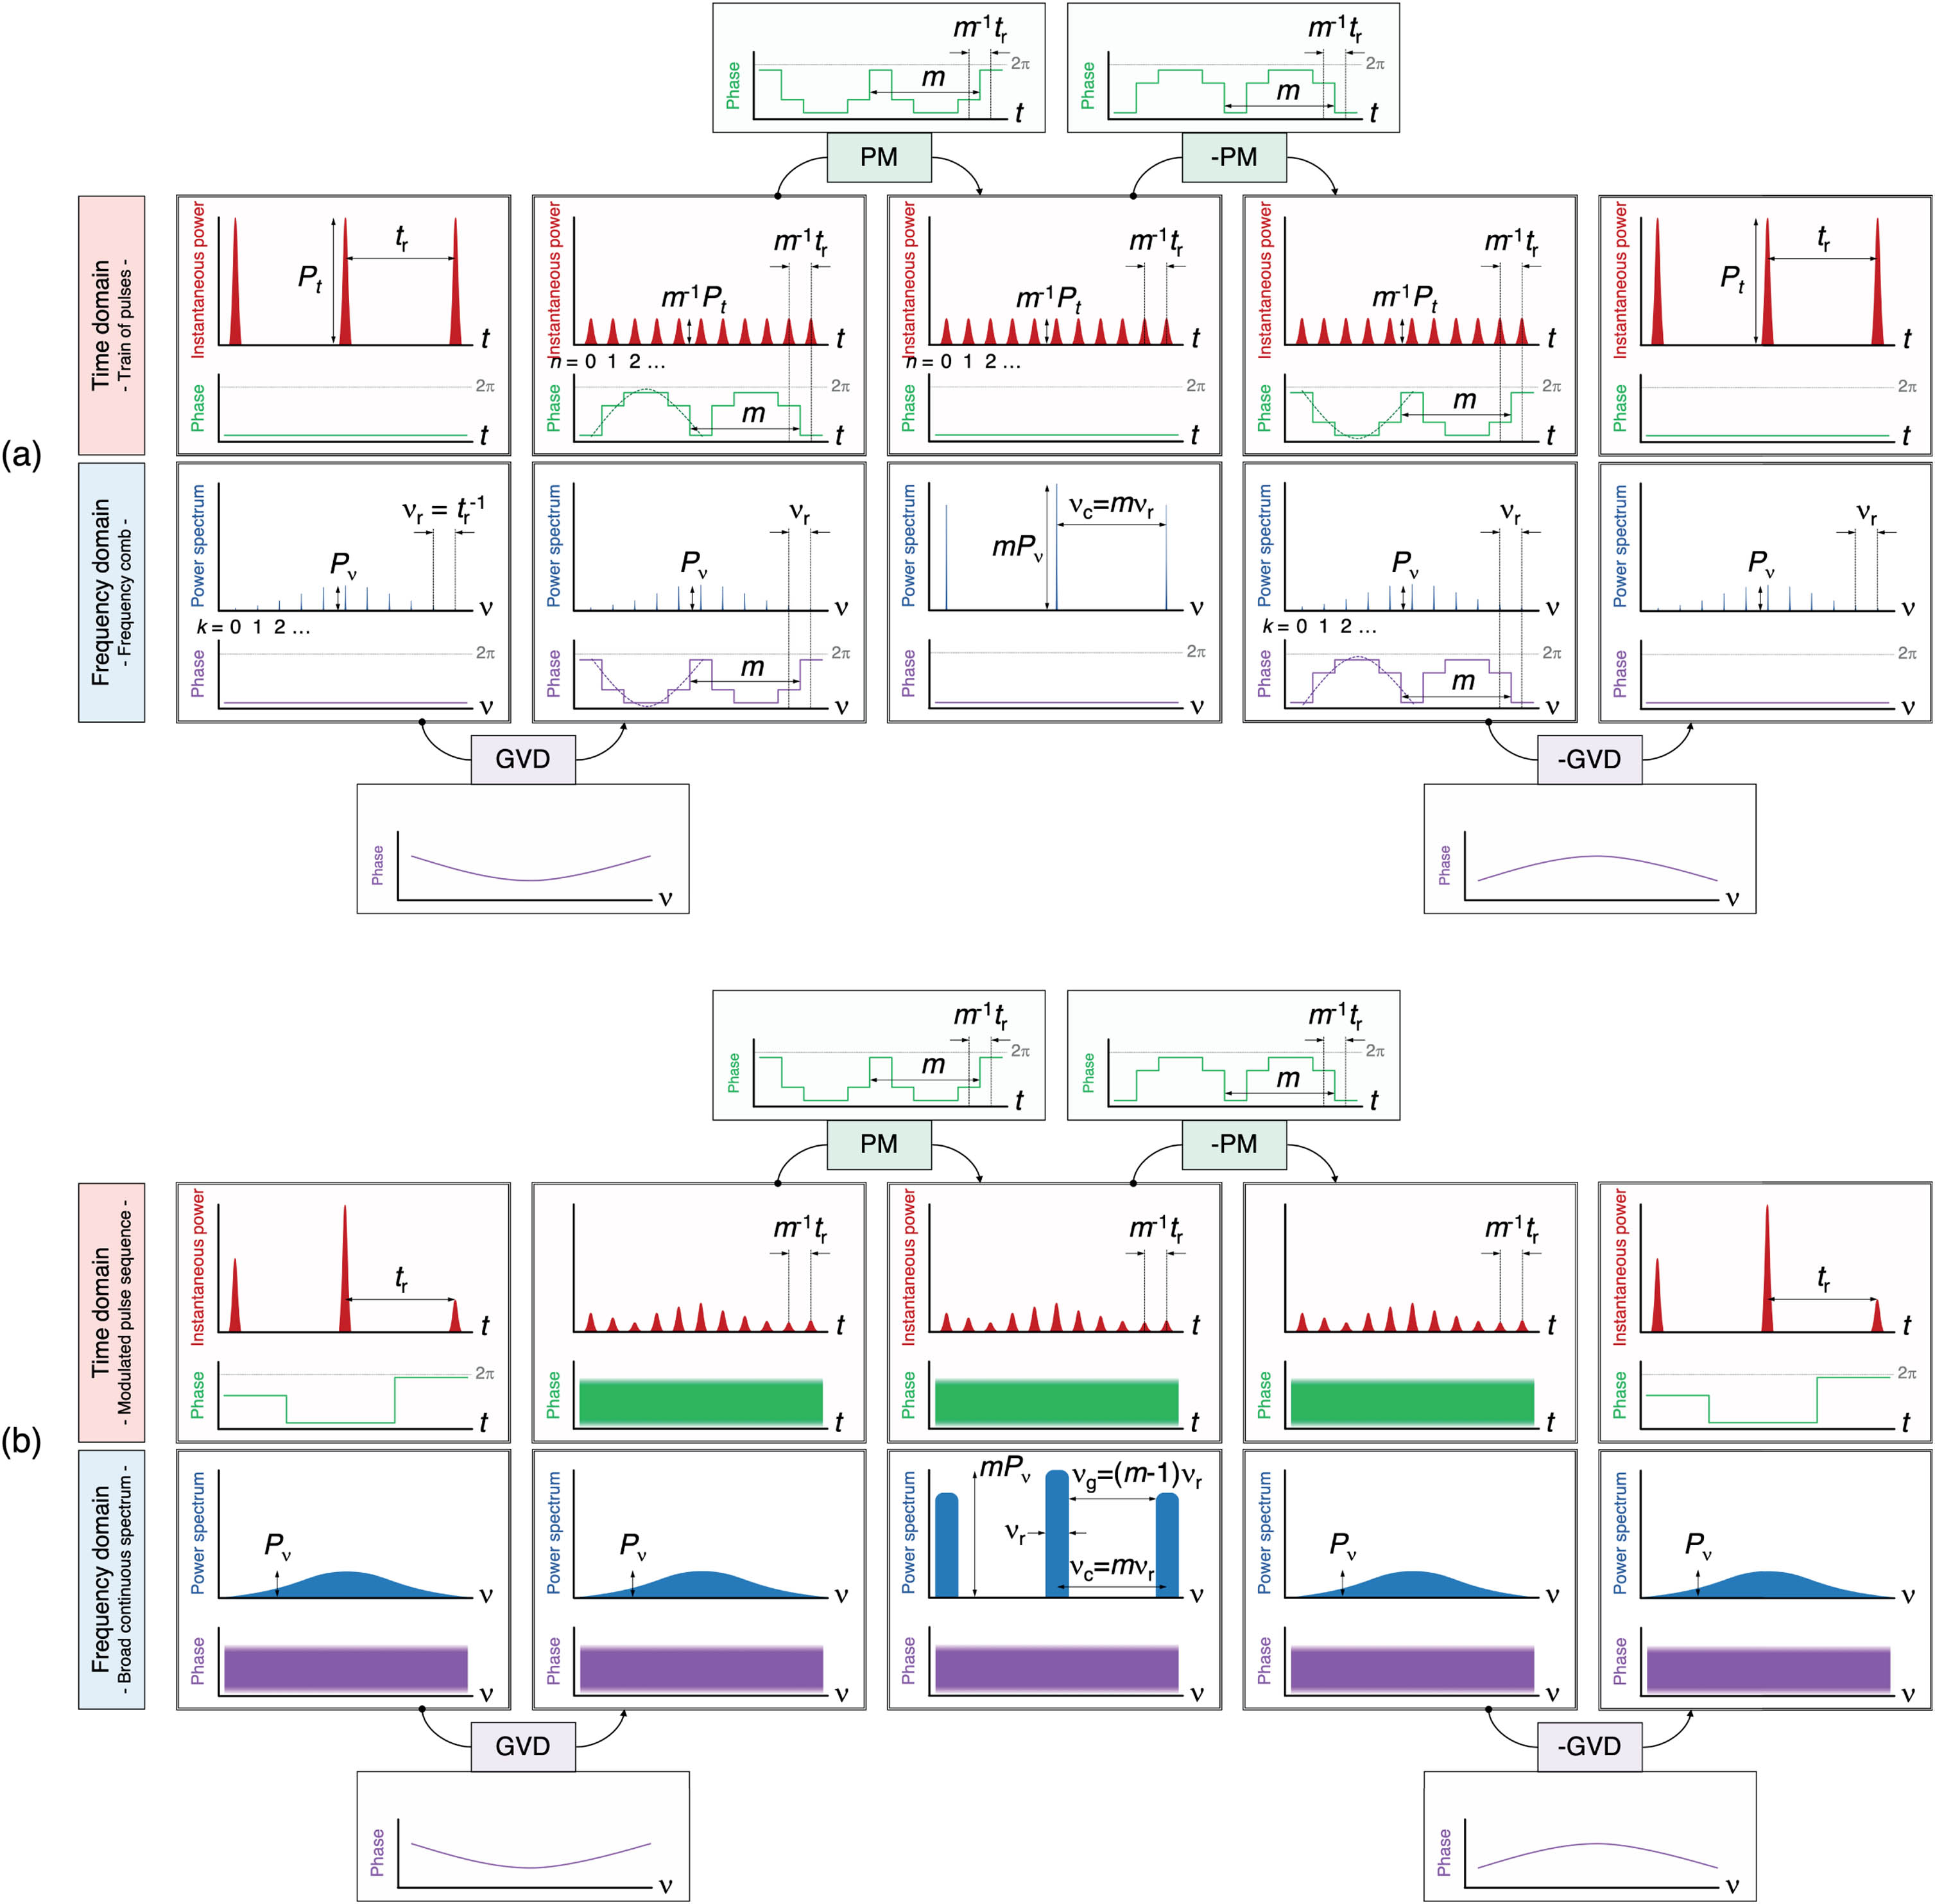
    Fig. 2. Reversible wave transformations for waveform-preserving spectral compression. Summary of the steps involved in the spectral compression process, including phase-only manipulations along the time and frequency domains for (a) a periodic sequence of short pulses, corresponding to a frequency comb (discrete broadband frequency spectrum), shown here to explain the proposed concept, and (b) a modulated sequence of short pulses (continuous broadband frequency spectrum), showing waveform-preserving spectral compression. See main text for parameter definitions; PM and GVD stand for temporal phase modulation and group-velocity dispersion, respectively; t holds for time and ν holds for frequency.
    Frequency-domain representation of the frequency gap generation process. (a) Spectrum of a tr-periodic pulse train, consisting of a periodic set of discrete frequency components (spaced by νr=tr−1) spanning over the bandwidth of a single pulse, Δν. (b) Spectrum of the function ψe(t), Ψe(ν), defined as a band-limited signal that underlines a temporal envelope of the data signal and exactly satisfies the Nyquist sampling criterion for the pulse rate νr. (c) Spectrum of the data-modulated signal ψd(t), Ψd(ν), consisting of periodic replicas of Ψe(ν) spaced by νr. (d) Spectrum of the compressed data-modulated signal, after application of the frequency-gap generation process; due to the frequency-domain periodicity of Ψd(ν), the Talbot-based phase transformations described in the main text rearrange its spectrum in groups of m periods, creating energy-free gaps, with the depicted specifications.
    Fig. 3. Frequency-domain representation of the frequency gap generation process. (a) Spectrum of a tr-periodic pulse train, consisting of a periodic set of discrete frequency components (spaced by νr=tr1) spanning over the bandwidth of a single pulse, Δν. (b) Spectrum of the function ψe(t), Ψe(ν), defined as a band-limited signal that underlines a temporal envelope of the data signal and exactly satisfies the Nyquist sampling criterion for the pulse rate νr. (c) Spectrum of the data-modulated signal ψd(t), Ψd(ν), consisting of periodic replicas of Ψe(ν) spaced by νr. (d) Spectrum of the compressed data-modulated signal, after application of the frequency-gap generation process; due to the frequency-domain periodicity of Ψd(ν), the Talbot-based phase transformations described in the main text rearrange its spectrum in groups of m periods, creating energy-free gaps, with the depicted specifications.
    (a) Schematic of the experimental setup for demonstration of waveform-preserving spectral compression of a modulated pulse sequence. MLL, mode-locked laser; BPG, bit pattern generator; MZM, Mach–Zehnder modulator; DCF, dispersion-compensating fiber; EOPM, electro-optical phase modulator; AWG, arbitrary waveform generator; POF, programmable optical filter; SMF, single-mode fiber; OSA, optical spectrum analyzer; OSO, optical sampling oscilloscope; EPA, error performance analyzer [31]. Reference points: (i) modulated input pulsed signal, (ii) signal with compressed spectrum, (iii) signal after test filter, (iv) output de-compressed signal. (b) Periodic temporal Talbot phase modulation profile required after dispersion for FSR multiplication by m=4. Vπ represents the half-wave voltage of the electro-optic phase modulator, i.e., the voltage level at which the modulated signal experiences an instantaneous phase shift of π radians. (dashed line) Prescribed phase; (solid line) measured phase modulator drive voltage.
    Fig. 4. (a) Schematic of the experimental setup for demonstration of waveform-preserving spectral compression of a modulated pulse sequence. MLL, mode-locked laser; BPG, bit pattern generator; MZM, Mach–Zehnder modulator; DCF, dispersion-compensating fiber; EOPM, electro-optical phase modulator; AWG, arbitrary waveform generator; POF, programmable optical filter; SMF, single-mode fiber; OSA, optical spectrum analyzer; OSO, optical sampling oscilloscope; EPA, error performance analyzer [31]. Reference points: (i) modulated input pulsed signal, (ii) signal with compressed spectrum, (iii) signal after test filter, (iv) output de-compressed signal. (b) Periodic temporal Talbot phase modulation profile required after dispersion for FSR multiplication by m=4. Vπ represents the half-wave voltage of the electro-optic phase modulator, i.e., the voltage level at which the modulated signal experiences an instantaneous phase shift of π radians. (dashed line) Prescribed phase; (solid line) measured phase modulator drive voltage.
    Spectral compression and subsequent full recovery of a short-pulse data sequence; experimental results. Generation of frequency gaps in a sequence of short optical pulses with binary intensity modulation (on-off-keying, OOK). (1) Frequency domain (power spectrum and envelope) and (2) time domain (pulse sequence, eye diagram, and pulse trace) measurements. (a) Original sequence, obtained by direct amplitude modulation of a repetitive optical pulse train or periodic optical frequency comb (shown for reference) with a binary PRBS. (b) Sequence after application of the proposed spectral compression process. The overall spectral envelope and temporal pulse shape (including duration) remain unaltered, while periodic frequency gaps are induced in the sequence. (c) Testing of the frequency gaps by introducing a periodic band-stop filter. The temporal sequence is unaffected by the filter, a result that confirms that the created gaps contain no information. (d) Output sequence after the application of the reverse phase transformations, closing the frequency gaps and reverting the modulated temporal data sequence to its exact original state.
    Fig. 5. Spectral compression and subsequent full recovery of a short-pulse data sequence; experimental results. Generation of frequency gaps in a sequence of short optical pulses with binary intensity modulation (on-off-keying, OOK). (1) Frequency domain (power spectrum and envelope) and (2) time domain (pulse sequence, eye diagram, and pulse trace) measurements. (a) Original sequence, obtained by direct amplitude modulation of a repetitive optical pulse train or periodic optical frequency comb (shown for reference) with a binary PRBS. (b) Sequence after application of the proposed spectral compression process. The overall spectral envelope and temporal pulse shape (including duration) remain unaltered, while periodic frequency gaps are induced in the sequence. (c) Testing of the frequency gaps by introducing a periodic band-stop filter. The temporal sequence is unaffected by the filter, a result that confirms that the created gaps contain no information. (d) Output sequence after the application of the reverse phase transformations, closing the frequency gaps and reverting the modulated temporal data sequence to its exact original state.
    Schematic of the experimental setup for in-band wavelength division multiplexing of an NRZ signal in the compressed bandwidth of an RZ signal. MLL, mode-locked laser; CW, continuous-wave laser; BPG, bit pattern generator; RFA, radio-frequency amplifier; MZM, Mach–Zehnder modulator; EDFA, erbium-doped fiber amplifier; DCF, dispersion-compensating fiber; AWG, arbitrary waveform generator; EOPM, electro-optic phase modulator; YC, Y-coupler; POF, programmable optical filter; SMF, single-mode fiber; OSA, optical spectrum analyzer; OSO, optical sampling oscilloscope; EPA, error performance analyzer [31].
    Fig. 6. Schematic of the experimental setup for in-band wavelength division multiplexing of an NRZ signal in the compressed bandwidth of an RZ signal. MLL, mode-locked laser; CW, continuous-wave laser; BPG, bit pattern generator; RFA, radio-frequency amplifier; MZM, Mach–Zehnder modulator; EDFA, erbium-doped fiber amplifier; DCF, dispersion-compensating fiber; AWG, arbitrary waveform generator; EOPM, electro-optic phase modulator; YC, Y-coupler; POF, programmable optical filter; SMF, single-mode fiber; OSA, optical spectrum analyzer; OSO, optical sampling oscilloscope; EPA, error performance analyzer [31].
    In-band wavelength-division multiplexing/demultiplexing of an NRZ data signal within the bandwidth occupied by an RZ data signal, using the described process for frequency gap generation; experimental results. Frequency domain (power spectrum) measurements: (a) spectrum of the RZ signal, (b) spectrum of the NRZ signal, (c) spectrum of the NRZ signal inserted in one of the frequency gaps induced in the RZ spectrum, (d) extraction of the NRZ signal by use of an optical filter, (e) output RZ spectrum after the frequency gaps are closed (following extraction of the NRZ signal), and (f) output (extracted) NRZ spectrum. Time domain (pulse sequence and eye diagram) measurements: (g) input RZ temporal trace, (h) input NRZ temporal trace, (i) output RZ temporal trace, (j) output NRZ temporal trace, (k) input RZ eye diagram, (l) output RZ eye diagram, (m) input NRZ eye diagram, and (n) output NRZ eye diagram.
    Fig. 7. In-band wavelength-division multiplexing/demultiplexing of an NRZ data signal within the bandwidth occupied by an RZ data signal, using the described process for frequency gap generation; experimental results. Frequency domain (power spectrum) measurements: (a) spectrum of the RZ signal, (b) spectrum of the NRZ signal, (c) spectrum of the NRZ signal inserted in one of the frequency gaps induced in the RZ spectrum, (d) extraction of the NRZ signal by use of an optical filter, (e) output RZ spectrum after the frequency gaps are closed (following extraction of the NRZ signal), and (f) output (extracted) NRZ spectrum. Time domain (pulse sequence and eye diagram) measurements: (g) input RZ temporal trace, (h) input NRZ temporal trace, (i) output RZ temporal trace, (j) output NRZ temporal trace, (k) input RZ eye diagram, (l) output RZ eye diagram, (m) input NRZ eye diagram, and (n) output NRZ eye diagram.
    Performance quality analysis. Measured (a) Q factor of the eye diagram and (b) BER, for different values of transmitted signal power. Studied scenarios: B2B, back-to-back configuration; IN/OUT, RZ signal compressed/decompressed in the absence of NRZ signal; MUX/DEMUX, in-band wavelength division multiplexing, NRZ signal inserted in a frequency gap induced on the RZ signal spectrum and subsequently extracted.
    Fig. 8. Performance quality analysis. Measured (a) Q factor of the eye diagram and (b) BER, for different values of transmitted signal power. Studied scenarios: B2B, back-to-back configuration; IN/OUT, RZ signal compressed/decompressed in the absence of NRZ signal; MUX/DEMUX, in-band wavelength division multiplexing, NRZ signal inserted in a frequency gap induced on the RZ signal spectrum and subsequently extracted.
    Spectral compression by reversible frequency-gap generation of a 27−1 PRBS RZ signal with parameters: νr=9.45 GHz, m=2, Δt=44.2 ps. (a) Input spectrum. (b) Input eye diagram. (c) Spectrum of the compressed signal (input spectrum shown shaded for reference). The resulting gap spectral period is νc=18.9 GHz, with a 3 dB bandwidth of ∼3.7 GHz.
    Fig. 9. Spectral compression by reversible frequency-gap generation of a 271 PRBS RZ signal with parameters: νr=9.45  GHz, m=2, Δt=44.2  ps. (a) Input spectrum. (b) Input eye diagram. (c) Spectrum of the compressed signal (input spectrum shown shaded for reference). The resulting gap spectral period is νc=18.9  GHz, with a 3 dB bandwidth of 3.7  GHz.
    Bit error rate measurement setup. EPA, error performance analyzer; ED, error detector; PUT, process under test; SUT, signal under test; VOA, variable optical attenuator; PD, photodiode.
    Fig. 10. Bit error rate measurement setup. EPA, error performance analyzer; ED, error detector; PUT, process under test; SUT, signal under test; VOA, variable optical attenuator; PD, photodiode.
    Luis Romero Cortés, Reza Maram, José Azaña. Fully reversible spectral compression of arbitrary pulsed data signals[J]. Photonics Research, 2020, 8(5): 659
    Download Citation