Luis Romero Cortés, Reza Maram, José Azaña, "Fully reversible spectral compression of arbitrary pulsed data signals," Photonics Res. 8, 659 (2020)
Copy Citation Text
Data signals consisting of arbitrarily modulated sequences of pulses are extensively used for processing and communication applications. The spectral extent of such signals is determined by the bandwidth of the individual pulses in the sequence, which imposes a fundamental limit to the maximum amount of information that can be transmitted or processed per time period. In this work, we propose and experimentally demonstrate that the frequency spectrum occupied by a data-modulated pulse sequence can be significantly compressed to well below the individual pulse bandwidth while still maintaining the temporal duration of the pulses in the sequence and without losing any of the information carried by the signal. The proposed method involves fully reversible linear transformations of the data signal along the time and frequency domains. We demonstrate successful pulse-shape-preserving spectral compression and subsequent full waveform and information recovery of a ~ optical pulse sequence, modulated by an arbitrary data pattern, liberating over 60% of its bandwidth. These findings should prove useful for applications in signal processing, communications, and others.
1. INTRODUCTION
Pulsed data signals are routinely used in information processing and communication systems. Such signals codify the information in the temporal variations of the intensity and/or phase of a wave [1]. In general, a data signal consists of a sequence of periodic pulses that are consecutively modulated to carry the desired arbitrary (e.g., random) complex data pattern, symbol to symbol (i.e., pulse to pulse). The duration of the coded pulses cannot exceed the inter-symbol temporal period, i.e., the inverse of the symbol rate [2]. In any case, the data signal occupies a continuous frequency spectrum over the full spectral bandwidth of the individual coded pulses. The amount of information that can be processed per time period over the available bandwidth (i.e., the spectral efficiency) is ultimately limited by the extent of the signal’s frequency spectrum, so that a narrower data signal spectrum translates into an increased spectral efficiency (for a prescribed number of bits per symbol and a given symbol rate). It is also well known that the use of shorter pulses to carry the information signal translates into important performance advantages for information processing and communication, including lower power consumption, higher net data rates, simpler synchronization, and higher tolerance to propagation impairments, among others [1,3–14]. However, as imposed by the Fourier time/frequency uncertainty relationship [15], a shorter temporal pulse requires a broader spectral bandwidth to code the desired data, with the associated degradation in the resulting spectral efficiency.
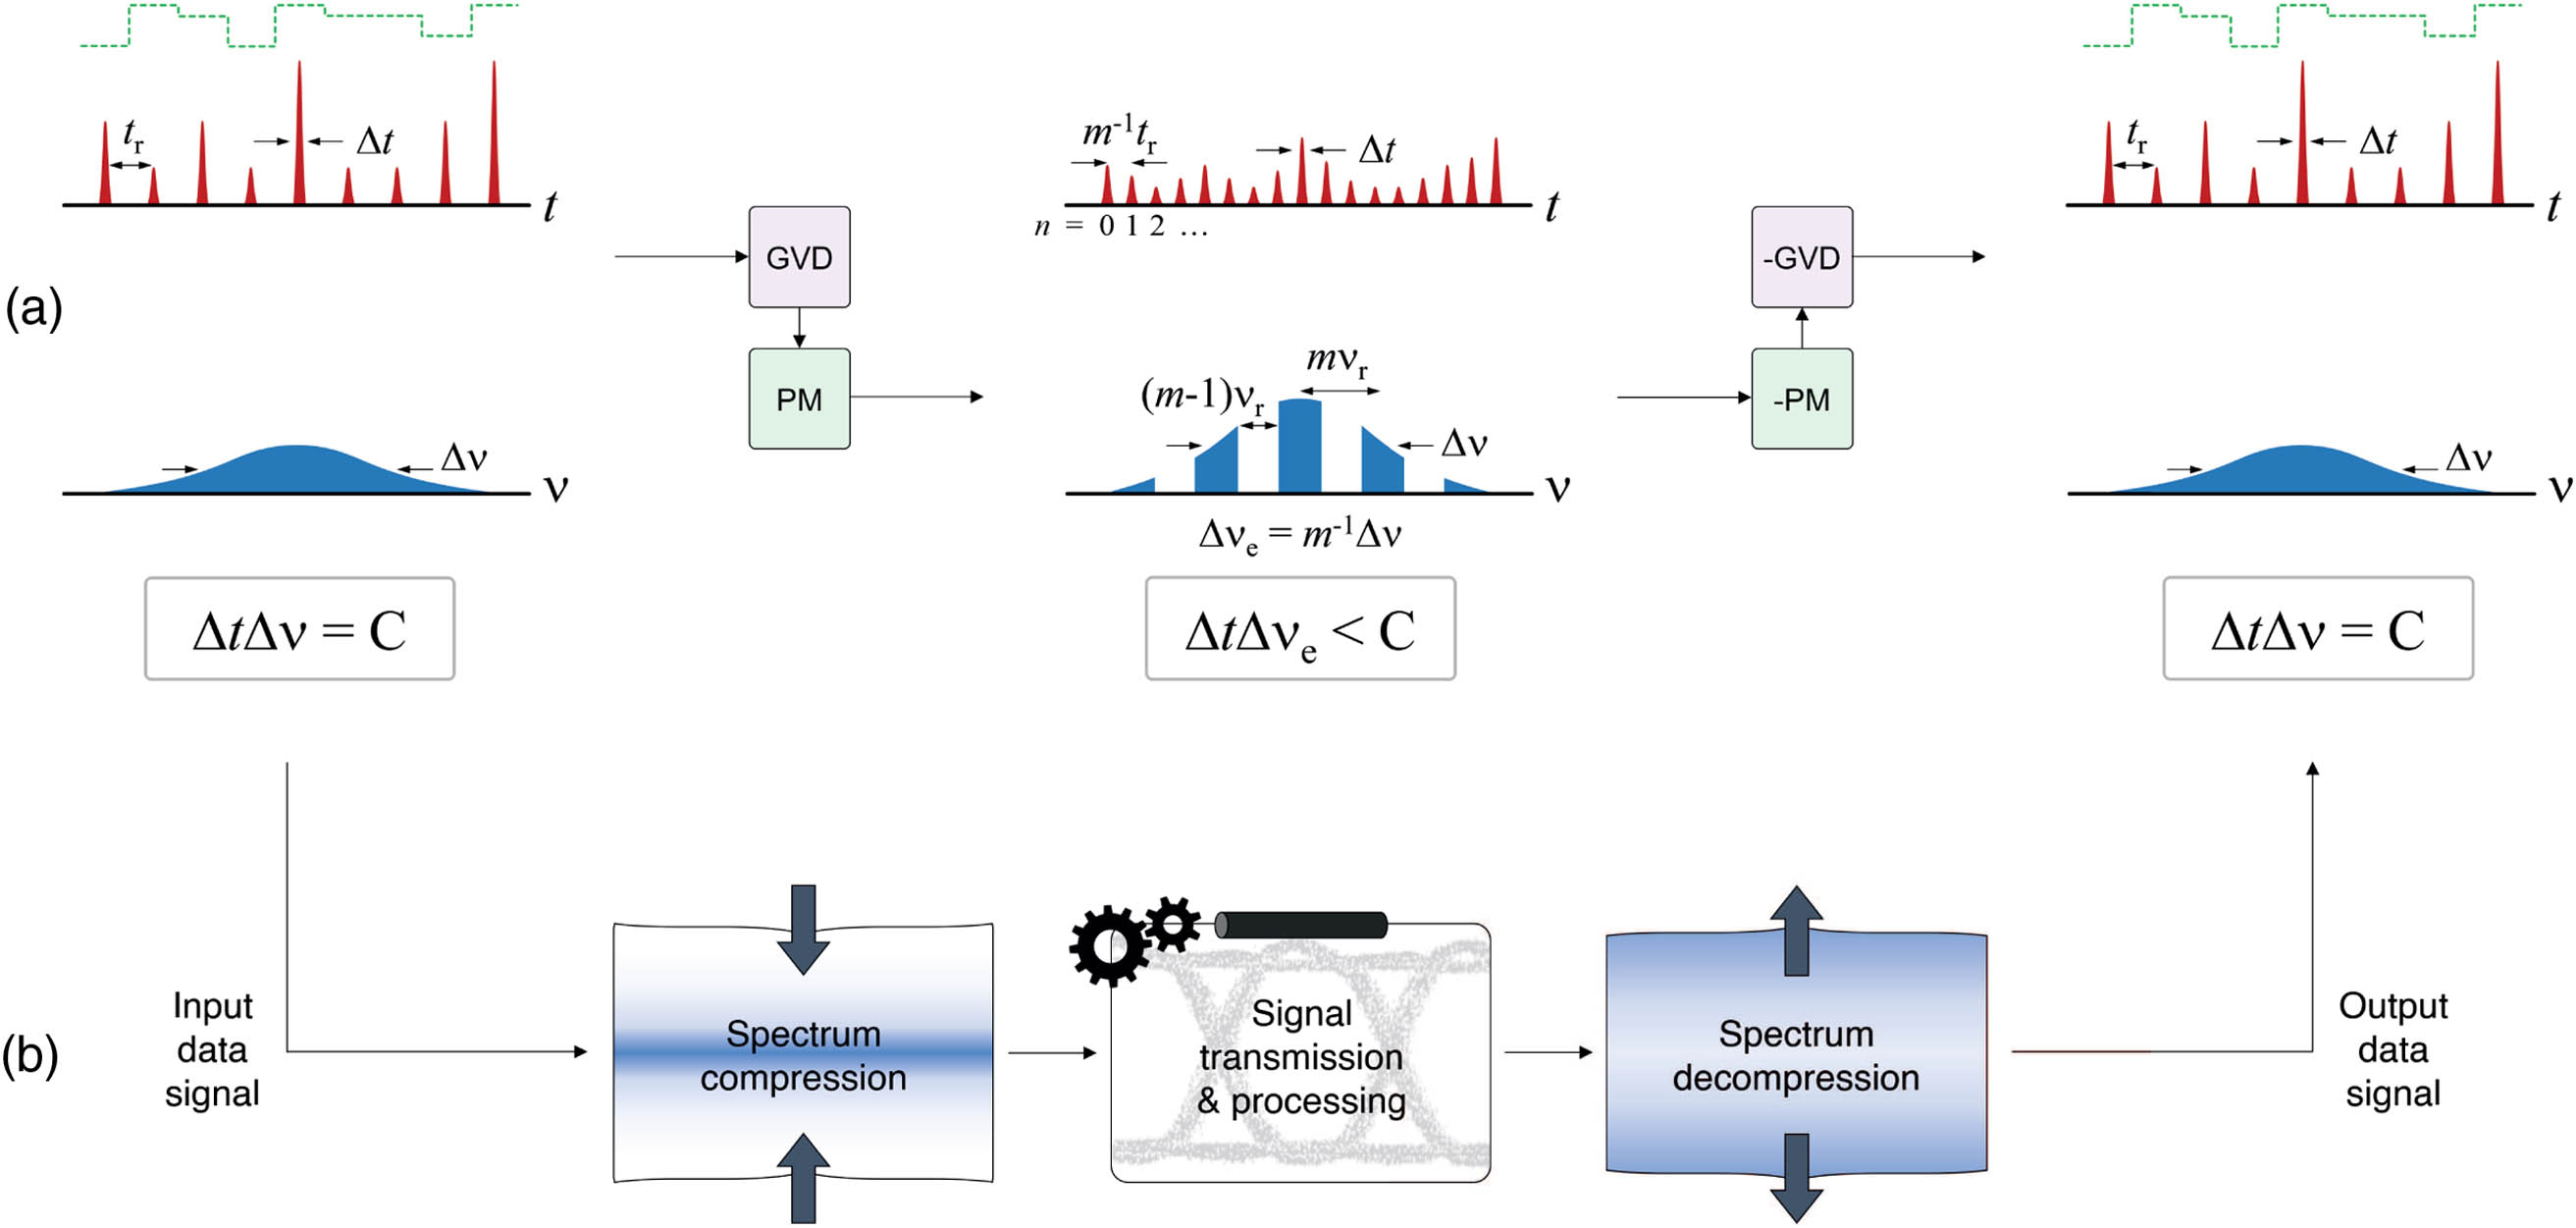
In this work, we propose and experimentally demonstrate a simple and general linear processing scheme that allows one to compress the frequency spectrum of a data signal, consisting of arbitrary (e.g., random) modulated short pulses, while maintaining the shape and duration of the pulses in the time domain. The principle relies on the fact that, while it is not possible to compress the spectrum of a pulse below the limit set by the Fourier uncertainty principle (i.e., without increasing the pulse duration), it is possible, however, to do so by operating over the entire pulse sequence and not over its individual constituent pulses. As shown in Fig. 1(a), the proposed method introduces a custom-designed set of wide zero-energy frequency gaps across the spectrum of the data signal through suitable linear transformations of the temporal and spectral phase profiles of the input signal. The required transformations can be practically implemented using widely available group-velocity dispersion (GVD) and quadratic temporal phase modulation (TPM) processes. In particular, the proposed design achieves effective compression of the total frequency range occupied by the sequence without widening the temporal duration of the resulting pulses. The spectrally compressed signal can then be transmitted and/or processed using lower bandwidth of the transmission link and/or processing system [see Fig. 1(b)]. The phase-only linear nature of the spectral-compression mechanism ensures full preservation of the input data signal features, including energy and information, allowing for the transformations to be completely reversed. In this way, the original signal can be subsequently recovered without any loss of information, including full recovery of the exact original pulsed data waveform. Our findings could have important direct implications in disciplines such as signal processing and communications, as discussed below.
Figure 1.(a) Illustration of the proposed concept for waveform-preserving spectral compression of data-modulated short-pulse sequences. This is achieved through a suitable combination of reversible phase-only linear transformations (GVD, second-order group-velocity dispersion; PM, quadratic temporal phase modulation). Such phase transformations produce the desired spectral compression while maintaining the original individual pulse shape: the overall spectral width remains unchanged, but periodic frequency gaps (with no remaining signal energy) are introduced in the spectrum, reducing the effective occupied bandwidth. The original data-modulated waveform can be fully recovered through application of the inverted phase transformations (−GVD, −PM). (b) Example of a potential use of the proposed spectral compression process in a data signal communication (or processing) system. The data signal is transmitted through the system following spectral compression by reversible linear transformations, thus utilizing a lower bandwidth of the transmission medium. At the output of the communication link, following compensation of all transmission impairments undergone by the propagating signal, the inverted transformations are applied on the received signal, restoring the data waveform to its exact original state.
The phase transformations involved in the spectral compression process are derived from the mathematical framework of the Talbot effect [16–21]. Wave transformations based on the theory of the Talbot effect have been recently used to induce frequency gaps across the spectrum of an isolated short pulse [22]. In the work reported herein, we propose and demonstrate that similar phase transformations can be designed to create reversible zero-energy wide-frequency gaps in the broad continuous spectrum of an infinitely long and arbitrarily modulated pulse sequence.
Sign up for Photonics Research TOC. Get the latest issue of Photonics Research delivered right to you!Sign up now
Figure 2 shows the details of the involved time and frequency transformations in the proposed method. For convenience and simplicity of explanation, let us first consider the case of a periodic train of transform-limited pulses , with repetition period , where each individual pulse, , has a temporal full width at half maximum (FWHM) [see corresponding illustrations in Fig. 2(a)]: where * is the convolution integral operator and is the Dirac’s delta function.
Figure 2.Reversible wave transformations for waveform-preserving spectral compression. Summary of the steps involved in the spectral compression process, including phase-only manipulations along the time and frequency domains for (a) a periodic sequence of short pulses, corresponding to a frequency comb (discrete broadband frequency spectrum), shown here to explain the proposed concept, and (b) a modulated sequence of short pulses (continuous broadband frequency spectrum), showing waveform-preserving spectral compression. See main text for parameter definitions; PM and GVD stand for temporal phase modulation and group-velocity dispersion, respectively; holds for time and holds for frequency.
The spectrum of such a periodic pulse train, , is a frequency comb, i.e., a discrete set of equally spaced frequency components, with a frequency spacing (the free spectral range [FSR]) equal to the repetition rate of the train [15,23]: where is the spectrum of a single pulse [i.e., the Fourier transform of ]. As such, the 3 dB frequency bandwidth, , is related to through the Fourier uncertainty principle in the transform-limited case, , where is the time-bandwidth product (TBP), which depends on the complex temporal pulse shape.
When such a signal propagates through a second-order GVD medium, through which different frequency components propagate at different speeds, each pulse of the train is stretched in time, while the power frequency spectrum of the sequence remains unaltered [23]. If the amount of induced GVD satisfies a so-called fractional temporal Talbot condition, consecutive dispersed pulses in the sequence interfere with each other in such a way that the individual pulses are exactly reconstructed at the output of the medium but with a temporal period that is reduced with respect to the input one by an integer factor, becoming [20,21,24]. This result is a direct consequence of the collective interaction between many consecutive pulses of the sequence within the dispersive medium. We recall that second-order GVD propagation corresponds to the application of a spectral phase profile, , which exhibits a quadratic dependence on the frequency variable, as follows: where is the radial frequency variable, is the second-order dispersion coefficient of the medium (i.e., the second-order GVD per unit length), and is the propagation length.
The condition for the amount of induced GVD to produce a temporal Talbot effect on a -periodic train of pulses is as follows [20,21,24]: where and are two mutually prime natural numbers (with being the repetition rate multiplication factor).
In the frequency domain, the FSR of the corresponding comb remains unaltered after the dispersive propagation, but the th comb line acquires a deterministic phase shift given by where is the sign of the parameter ( if , and if ).
The obtained spectrum writes Note that Eq. (5) is simply obtained by evaluating Eq. (3) at integer multiples of (i.e., for ), with a value of that satisfies the condition given in Eq. (4).
At the output of the dispersive medium, the individual pulses are reconstructed with no distortion of their original temporal shape. The period of the sequence, however, is reduced by the factor , becoming [20,21,24]; similarly, the energy per pulse at the output of the medium is reduced by the factor with respect to the energy of input pulses. Furthermore, as stated, the power spectrum of the obtained comb is identical to that of the input signal, even though the FSR associated with the -divided pulse period should be times longer. This is because, under the Talbot condition in Eqs. (4) and (5), the th pulse of the period-divided output train acquires a deterministic phase that, except for a constant phase term, can be written as [20] where is a natural number, mutually prime with , so that [25] where is the parity of the parameter ( if is even, and if is odd).
The time-domain representation of the obtained signal (neglecting a constant phase factor) writes [20] where the corresponding pulse period has been divided by the factor , and the term only represents an overall delay of the resulting sequence, corresponding to a linear phase term in the frequency domain.
If these residual pulse-to-pulse phase variations are subsequently equalized by means of a temporal phase modulation (PM) mechanism, the FSR of the resulting comb-like spectrum, i.e., the frequency spacing, or gap, in between discrete frequency lines, is increased -fold with respect to the input [21,26]. The overall bandwidth of the comb, however, remains equal to [see the detailed representation in Fig. 2(a)].
The case under consideration here is that of a data-modulated pulse sequence, in which the original periodic pulse train is temporally modulated in amplitude and/or phase, pulse-to-pulse, following an arbitrary (e.g., random) data pattern, with a corresponding symbol rate [see detailed illustrations for this case in Fig. 2(b)]. The resulting temporal data signal, here referred to as , writes where is the temporal profile of a single pulse, and is a complex number representing the amplitude and phase of the th data symbol. The function can be rewritten as follows: where is a complex envelope function that satisfies the two following conditions: (i) its full bandwidth is , the inverse of the pulse period (exactly satisfying the Nyquist sampling criterion), and (ii) , so that the value of the envelope coincides with the value of each data symbol at -periodic instants.
The spectrum of , schematically depicted in Fig. 3, writes where and are the spectra of and , respectively.
Figure 3.Frequency-domain representation of the frequency gap generation process. (a) Spectrum of a -periodic pulse train, consisting of a periodic set of discrete frequency components (spaced by ) spanning over the bandwidth of a single pulse, . (b) Spectrum of the function , , defined as a band-limited signal that underlines a temporal envelope of the data signal and exactly satisfies the Nyquist sampling criterion for the pulse rate . (c) Spectrum of the data-modulated signal , , consisting of periodic replicas of spaced by . (d) Spectrum of the compressed data-modulated signal, after application of the frequency-gap generation process; due to the frequency-domain periodicity of , the Talbot-based phase transformations described in the main text rearrange its spectrum in groups of periods, creating energy-free gaps, with the depicted specifications.
This way, the frequency-domain representation of the data-modulated signal, , exhibits a continuous energy spectrum along the full frequency bandwidth of the short pulses in the sequence, [15]. This continuous spectrum is, in fact, periodic, consisting of consecutive replicas of the spectrum of , with a frequency separation [see Fig. 3(c)]. The spectral compression process proposed here consists of the following two steps.
A. Spectral Phase Filtering
First, a -periodic spectral phase function (i.e., a spectral phase filter) is applied to , so that each spectral replica of is phase-shifted with respect to its neighbors according to the Talbot condition in Eq. (5). The resulting spectrum writes and, using the Fourier relationship reported above, between the functions in Eqs. (6) and (9) [20], the time-domain representation (neglecting a constant phase factor) of the frequency-domain signal in Eq. (13) writes
B. Temporal Phase Modulation
The obtained temporal signal can be interpreted as an oversampled version of the signal in Eq. (11) by the factor (i.e., where the new pulse rate is ), with an additional pulse-to-pulse temporal phase term, given by Eq. (7). If this extra phase term is cancelled through temporal phase modulation, the following signal is obtained: and, neglecting the term , which corresponds to a linear phase term in the frequency domain, its spectrum writes with Note that the resulting spectrum consists of periodic replicas of , where the spectral period, , is now times larger than that of the original data signal, [see Fig. 3(d)]. Considering that the bandwidth of is , a periodic set of energy-free frequency gaps is generated on the spectrum of , each spanning over a spectral extent, gap bandwidth, of Thus, the described process produces an effective compression of the overall frequency spectrum that is occupied by the modulated pulse sequence, reducing the effective bandwidth of the sequence to , while the spectral envelope maintains its original shape and width, . In fact, following the Talbot transformations, the individual temporal pulses of the compressed signal, , still preserve their original shape and duration, . Furthermore, application of the opposite phase transformations (−PM and −GVD) restores the data pulse sequence to its exact original state in both the temporal and spectral domains, as illustrated in Figs. 1(a) and 2(b).
In the following, we present experimental demonstrations of this concept using optical signals and conventional optical telecommunications components. In our demonstrations, we implement the desired spectral phase filtering operation as a continuous spectral phase function using optical group velocity dispersion satisfying the condition in Eq. (4) (similarly to the frequency comb case). This implements a quadratic spectral phase filter, rather than the ideal discrete spectral phase filtering function that is assumed in the analysis above, i.e., as introduced in Eq. (13). As a result, the waveform at the output of the dispersive medium may exhibit a temporal distortion, as compared with the ideal case, such that the temporal envelope of the compressed signal will generally not follow the values of the data modulation sequence. However, our numerical analysis and experimental results show that this deviation affects neither the features (shape, time width) of the rate-multiplied individual pulses in the resulting temporal sequence nor the formation of the mentioned frequency gaps along the spectrum of the signal of interest, achieving the predicted results over a broad range of operation conditions.
It should be noted that the data modulation on the pulse train breaks its original temporal periodicity. While the temporal Talbot effect typically requires a purely periodic pulsed waveform to manifest, interesting properties of the phenomenon have been previously observed on aperiodic pulse sequences, such as the capability of recovering the underlying periodic pulse structure out of the modulated sequence [27,28]. On the other hand, the spectrum of the pulsed data signal is still periodic, thus allowing for the described spectral compression effect to occur in the frequency domain.
3. EXPERIMENTAL DEMONSTRATION
The described linear transformations and, in particular, those related to realizations of the Talbot effect could, in principle, be implemented in any wave-based system, including across any region of the electromagnetic spectrum [29,30]. We present an experimental demonstration of the proposed concept on a typical optical pulsed data signal in the 1.55 μm wavelength window of fiber-optics telecommunications.
A. Spectral (De)compression
Figure 4(a) shows a simplified circuit schematic of the used experimental setup. A mode-locked laser generates optical pulses at a repetition rate [23], at a central frequency of 193 THz (corresponding to a central wavelength of 1551.2 nm). These pulses have a temporal FWHM width of , and a 3 dB spectral width of . The estimated TBP is then , close to the expected value of for transform-limited pulses. An electro-optical Mach–Zehnder modulator, driven by a bit pattern generator, is used to introduce a binary pseudo-random bit sequence (PRBS) to the pulse train, through direct amplitude modulation of the incoming optical pulses. An erbium-doped fiber amplifier is used to boost the signal after modulation. The resulting signal is referred to as a return-to-zero (RZ) modulated data sequence [2]. Figure 5(a1) shows the spectra of the initial frequency comb and the modulated signal as well as the envelope of its power spectrum. As expected, the modulated signal spectrum is a continuum over the full frequency bandwidth of the individual pulses. Figure 5(a2) shows the modulated pulse train, its eye diagram, and detail of a single pulse of the sequence.
Figure 4.(a) Schematic of the experimental setup for demonstration of waveform-preserving spectral compression of a modulated pulse sequence. MLL, mode-locked laser; BPG, bit pattern generator; MZM, Mach–Zehnder modulator; DCF, dispersion-compensating fiber; EOPM, electro-optical phase modulator; AWG, arbitrary waveform generator; POF, programmable optical filter; SMF, single-mode fiber; OSA, optical spectrum analyzer; OSO, optical sampling oscilloscope; EPA, error performance analyzer [31]. Reference points: (i) modulated input pulsed signal, (ii) signal with compressed spectrum, (iii) signal after test filter, (iv) output de-compressed signal. (b) Periodic temporal Talbot phase modulation profile required after dispersion for FSR multiplication by . represents the half-wave voltage of the electro-optic phase modulator, i.e., the voltage level at which the modulated signal experiences an instantaneous phase shift of radians. (dashed line) Prescribed phase; (solid line) measured phase modulator drive voltage.
Figure 5.Spectral compression and subsequent full recovery of a short-pulse data sequence; experimental results. Generation of frequency gaps in a sequence of short optical pulses with binary intensity modulation (on-off-keying, OOK). (1) Frequency domain (power spectrum and envelope) and (2) time domain (pulse sequence, eye diagram, and pulse trace) measurements. (a) Original sequence, obtained by direct amplitude modulation of a repetitive optical pulse train or periodic optical frequency comb (shown for reference) with a binary PRBS. (b) Sequence after application of the proposed spectral compression process. The overall spectral envelope and temporal pulse shape (including duration) remain unaltered, while periodic frequency gaps are induced in the sequence. (c) Testing of the frequency gaps by introducing a periodic band-stop filter. The temporal sequence is unaffected by the filter, a result that confirms that the created gaps contain no information. (d) Output sequence after the application of the reverse phase transformations, closing the frequency gaps and reverting the modulated temporal data sequence to its exact original state.
The modulated pulse sequence propagates then through a length of dispersion-compensating optical fiber, playing the role of the required dispersive medium, with a GVD amount of . This corresponds to a value , which, with the given value of , satisfies a fractional temporal Talbot condition for and [Eq. (4)]. At the working wavelength, this corresponds to the opposite dispersion of approximately 20 km of standard single-mode fiber. An electro-optical phase modulator (EOSpace 40 GHz), driven by an electronic arbitrary waveform generator (Tektronix AWG70000A 50 GSa/s), compensates for the temporal phase variations induced by the GVD propagation [see Fig. 4(b) for details on the phase modulation profile]. The resulting spectrum is shown in Fig. 5(b1), confirming that the anticipated frequency gaps are created across the original continuous spectrum, separated by a period of , while the global envelope of the power spectrum remains unaltered. Figure 5(b2) shows that the original pulse sequence is spread out into a larger number of short pulses, with an equivalent pulse rate that is increased by times with respect to the input one. As predicted, the newly obtained individual pulses retain the original time-width and overall temporal shape.
In order to confirm the spectral compression capability of the process, we introduce a linear optical test filter (Finisar Waveshaper 4000S) with a frequency response consisting of a set of stop bands with a spectral period of (close to ), overlapping the created frequency gaps in Fig. 5(c1). The 3 dB bandwidth of each of the stop bands is , each featuring an extinction ratio of 30 dB. Due to the presence of the frequency gaps, the signal propagates through the filter without any significant effect on its spectrum; consequently, the temporal waveform remains entirely unaffected [Fig. 5(c2)]. This demonstrates that the effective bandwidth of the modulated signal was compressed, at least, by a factor . In other words, over 60% of the frequency spectrum occupied by the input data signal was freed in the reported experiment while maintaining the original temporal shape of the pulses in the sequence. It should be noted that, ideally, for the designed value of , the expected spectral compression should reach 75%. However, practical imperfections in the implementation of the phase modulation (limited by available electronic bandwidth) and dispersion (associated to small deviations of fiber length from the ideal) lead to an imperfect suppression of the signal energy in the frequency gaps, up to in the reported experiments.
Finally, as predicted, owing to the energy-preserving and linear nature of the involved transformations, application of the opposite temporal phase modulation profile and propagation through an optical fiber with opposite GVD (20 km of single-mode fiber) restores the data signal to its exact original state, both in the frequency and time domains [Fig. 5(d)].
The measurements of the power spectra of the involved signals were carried out by an optical spectrum analyzer with a frequency resolution of 140 MHz (Apex AP2081A). All time-domain measurements, including instantaneous power traces and eye diagrams, were performed by an optical sampling oscilloscope with an acquisition bandwidth of 500 GHz.
B. In-Band Wavelength Division Multiplexing
The reported process for spectrum compression provides a conceptually simple method for increasing the maximum spectral efficiency that can be delivered by a given arbitrary data signal. As demonstrated by the results shown in Fig. 5, the generated frequency gaps contain no useful information for the reconstruction of the original data sequence. Such free spectral regions could be used by other signals in order to share a common transmission medium and resources, i.e., using wavelength-division multiplexing (WDM) [1,32].
Figures 6 and 7 show, respectively, the experimental setup and results of an experiment where an additional signal is transmitted alongside the modulated RZ sequence in Fig. 5. Such a signal is a nonreturn-to-zero (NRZ) data sequence, obtained by direct binary amplitude modulation of a continuous wave laser at a bit rate equal to that of the RZ sequence, i.e., at 9.45 Gb/s, with a PRBS different to that introduced to the RZ sequence. Recall that, in an NRZ data sequence, each coded pulse occupies the entire temporal bit period, without a rest condition in between consecutive bits [2]. Figures 7(a), 7(g), 7(b), and 7(h) show the spectral and temporal power distributions of the involved RZ and NRZ signals, respectively (corresponding input eye diagrams in Figs. 7(k) and 7(m)]. After the spectral compression process, the NRZ signal is coupled through a Y-coupler and inserted in-band into one of the frequency gaps introduced along the RZ spectrum [see Fig. 7(c)]; this is possible because both signals are spectrally orthogonal (i.e., their spectra do not overlap when sharing the same transmission medium). The two signals are easily separable (i.e., demultiplexed) in the frequency domain using selective amplitude filters [1,32]. Two filtering functions are introduced via a programmable optical filter: a single stop band with 24 GHz 3 dB bandwidth and 30 dB extinction ratio for extracting the RZ spectrum [see Fig. 7(d)] and a single passband with 24 GHz 3 dB bandwidth and 45 dB extinction ratio for extracting the NRZ spectrum [see Fig. 7(f)].
Figure 6.Schematic of the experimental setup for in-band wavelength division multiplexing of an NRZ signal in the compressed bandwidth of an RZ signal. MLL, mode-locked laser; CW, continuous-wave laser; BPG, bit pattern generator; RFA, radio-frequency amplifier; MZM, Mach–Zehnder modulator; EDFA, erbium-doped fiber amplifier; DCF, dispersion-compensating fiber; AWG, arbitrary waveform generator; EOPM, electro-optic phase modulator; YC, Y-coupler; POF, programmable optical filter; SMF, single-mode fiber; OSA, optical spectrum analyzer; OSO, optical sampling oscilloscope; EPA, error performance analyzer [31].
Figure 7.In-band wavelength-division multiplexing/demultiplexing of an NRZ data signal within the bandwidth occupied by an RZ data signal, using the described process for frequency gap generation; experimental results. Frequency domain (power spectrum) measurements: (a) spectrum of the RZ signal, (b) spectrum of the NRZ signal, (c) spectrum of the NRZ signal inserted in one of the frequency gaps induced in the RZ spectrum, (d) extraction of the NRZ signal by use of an optical filter, (e) output RZ spectrum after the frequency gaps are closed (following extraction of the NRZ signal), and (f) output (extracted) NRZ spectrum. Time domain (pulse sequence and eye diagram) measurements: (g) input RZ temporal trace, (h) input NRZ temporal trace, (i) output RZ temporal trace, (j) output NRZ temporal trace, (k) input RZ eye diagram, (l) output RZ eye diagram, (m) input NRZ eye diagram, and (n) output NRZ eye diagram.
The RZ sequence can be subsequently decompressed and restored to its exact original state in both the frequency and time domains following the previously described spectrum decompression method. Figures 7(e) and 7(f) show the power spectra resulting from the demultiplexing process; Figs. 7(i) and 7(j) show their corresponding output temporal sequences [output eye diagrams in Figs. 7(l) and 7(n)]. Since the NRZ format leaves no guard times between consecutive bits, conventional multiplexing along the time domain (time-division multiplexing, TDM) would not be possible for the two signals used here. The reported spectral compression process provides a way to perform a WDM process without using any additional bandwidth beyond that of the original frequency-overlapped signals.
C. Signal Quality Analysis
In order to study the potential degradation of signal quality due to the spectral compression/decompression process and subsequent signal processing operations (multiplexing/demultiplexing in the reported examples), we measure two well-established figures of merit, the quality factor of the temporal eye diagram (), and the bit error rate (BER) [1,32,33], shown in Figs. 8(a) and 8(b), respectively.
Figure 8.Performance quality analysis. Measured (a) factor of the eye diagram and (b) BER, for different values of transmitted signal power. Studied scenarios: B2B, back-to-back configuration; IN/OUT, RZ signal compressed/decompressed in the absence of NRZ signal; MUX/DEMUX, in-band wavelength division multiplexing, NRZ signal inserted in a frequency gap induced on the RZ signal spectrum and subsequently extracted.
For reference, we measure the factor and BER of the RZ and NRZ input signals (before spectral compression) for different values of transmitted optical power, referred to as the back-to-back configuration (B2B). We then perform measurements when the RZ signal undergoes the spectral compression/decompression process (IN/OUT configuration) and compare it with the previous B2B measurement (see Appendix A for further details on the measuring protocols used). The observed degradation is minimal; in particular, only 1 dB of additional optical power is required by the IN/OUT configuration to achieve the BER of the B2B configuration (power penalty measured at the standard error-free telecommunication threshold, ). Finally, we perform factor and BER measurements of the RZ and NRZ signals after they are multiplexed and demultiplexed (MUX/DEMUX configuration). Interestingly, no degradation of the RZ signal is observed in this configuration with respect to the IN/OUT configuration (where no additional signal was multiplexed). This further demonstrates that no remaining signal is contained within the frequency gaps induced by the spectral compression process.
4. DISCUSSION AND CONCLUSION
The presented spectral compression method relies on the application of a combination of spectral and temporal phase transformations to the pulsed data signal of interest. In the reported experiments, such operations are implemented as dispersive propagation of the signal through an optical fiber and electro-optical temporal phase modulation. The quality of the generated frequency gaps will then be determined by the practical realization of these processes. Visualization 1 shows a set of simulation results where the frequency gap generation process is implemented using limited modulation bandwidths and dispersion values that deviate from the ideal [given in Eq. (4)]. These results suggest that the 3 dB gap bandwidth is not affected by the PM and GVD impairments; however, the gap extinction degrades substantially for large deviations from the ideal specifications. In this context, it is important to note that, if the compressed signal is to be transmitted through a fiber link, compensation of the dispersion of the transmission fiber would be necessary; however, once the frequency gaps have been created, additional dispersion (e.g., due to fiber transmission) will not modify the signal’s power spectrum, including the frequency gaps. Moreover, the described in-band MUX/DEMUX process could still be carried out, even in the presence of additional dispersion. The involved signals should still be dispersion-compensated in order to recover the time-domain waveforms.
It should be noted that the proposed spectral gap generation process operates as described above on data signals where the guard time between consecutive pulses is at least times the input pulse width. This is due to the fact that fractional temporal Talbot effect requires such guard times in order to obtain an output sequence with pulse period from an input sequence with pulse period [21]. This way, the described methodology is better suited for application on pulsed data signals with low duty cycles (the ratio of the pulse width to the pulse period). However, the proposed concept still achieves frequency gap generation on pulse sequences that do not satisfy this condition, with the difference that the obtained gap bandwidth no longer follows the empirical expression given in Eq. (18). Figure 9 shows the results of an experiment where frequency gaps are generated on an RZ signal with , using the same protocols described in Section 3, with the only difference being that the input pulse width is now increased to . In this extreme case, the generated frequency gaps exhibit a 3 dB bandwidth of , as opposed to the 9.45 GHz predicted by Eq. (18).
Figure 9.Spectral compression by reversible frequency-gap generation of a PRBS RZ signal with parameters: , , . (a) Input spectrum. (b) Input eye diagram. (c) Spectrum of the compressed signal (input spectrum shown shaded for reference). The resulting gap spectral period is , with a 3 dB bandwidth of .
The reported experimental results suggest the potential immediate interest of the spectral compression method for applications such as optical in-band labeling in optical packet switching networks [34–36], and radio-over-fiber communications [37], where narrowband data sequences need to be multiplexed within the bandwidth of broadband pulsed data signals, necessarily introducing undesired distortions (e.g., associated with the need to filter out part of the signal spectrum). The proposed method could help in creating the needed spectral gaps to accommodate various additional data sequences without affecting the original optical broadband pulsed waveforms. Additionally, ultra-wideband technologies based on the use of coded short pulses (e.g., advanced radar, or lidar systems) could also benefit from multiplexing techniques based on the reported spectral compression method, allowing us to exploit simultaneously several data pulse sequences without interfering with neighboring frequency bands [38–40].
The reported findings could also prove generally useful in the context of broadband telecommunication systems. The use of short pulses (e.g., RZ coding) for transferring information, typically combined with the use of TDM strategies, presents significant advantages over their NRZ counterpart. For instance, short-pulse data coding allows for simpler synchronization and clock-recovery operations as well as for higher net data rates [1]. In the particular case of optical signal and information processing systems, short-pulse data sequences offer higher tolerance to noise, nonlinear effects, and polarization-mode dispersion, all of them critical impairments in present fiber-optics communication links [8–12]. Optical pulse-based transmission formats have also been demonstrated to provide important performance improvements in free-space communication systems under adverse atmospheric conditions [13]. Power-constrained optical communication systems, deep space communications, and transmission through turbulent media also favor the use of short pulses, typically in the form of pulse-position modulation schemes [14]. On the other hand, NRZ sequences are more spectrally efficient than RZ signals, i.e., NRZ data signals require a lower bandwidth for a given data rate. Whereas it is not possible to multiplex different NRZ data signals along the time domain for simultaneous transmission, i.e., using TDM, these signals are well suited for multiplexing along the frequency domain, i.e., using WDM, a multiplexing mechanism that is generally easier to implement, operate, and scale than its time-domain counterpart (TDM) [1,32,41]. The spectrum compression process reported herein provides significant enhancement of the spectral efficiency of RZ pulse sequences by liberating occupied bandwidth. In this way, one could envision an application scenario in which several RZ data sequences are multiplexed in frequency without occupying additional bandwidth, i.e., in-band WDM. This suggests a potentially interesting communication strategy that would combine the performance and robustness advantages of short-pulse data transmission with the simplicity and convenient operation of WDM. A numerical example of in-band wavelength-division multiplexing and demultiplexing of two RZ optical pulse data sequences through the proposed method is shown in Visualization 2. This example also shows how the described signal transformations produce a similar frequency-gap generation effect in the more general case of pulse sequences with multilevel complex (amplitude and phase) modulation formats, beyond the binary amplitude modulation reported in our experiments, such as those typically used in coherent communication systems [1].
Finally, it is interesting to note that, when the reported phase transformations are applied to a single pulse, rather than a pulse sequence, energy-free frequency gaps are still generated in the continuous single-pulse spectrum [22]. In this case, the periodicity of the temporal phase modulation function is no longer tied to the pulse repetition rate. However, in such a situation, the temporal duration of the resulting pulse is increased by the spectral phase filtering step, in sharp contrast to the case reported here, where the output pulses retain their original temporal duration. This is due to the fact that, in the reported case, the spectral compression process arises from the effect that the involved phase transformations have on the full pulse sequence, rather than their effect on each individual pulse.
In conclusion, we have proposed and experimentally demonstrated a method to compress the bandwidth of a pulsed data signal while preserving the temporal shape of its individual constituent pulses, and with no information loss. The technique is based on a smart set of linear lossless wave transformations that induce zero-energy wide-frequency gaps across the spectrum of the data signal of interest, so that the original temporal waveform can be fully reconstructed by simply reversing the applied wave transformations. Our findings could have important implications for systems relying on broadband signal processing and transmission, beyond the reported experimental demonstration at optical frequencies, including telecommunications, sensing, radar, lidar, and many others.
5. SIGNAL QUALITY METRICS
In order to study the potential degradation of signal quality due to the spectral compression/decompression process and subsequent signal processing operations, we measure two figures of merit: the quality factor of the temporal eye diagram () and the bit error rate (BER). Both metrics can be used to quantify the degradation that a process under test (PUT) introduces on a signal under test (SUT).
A. Bit Error Rate
The BER is the number of erroneous bits received per unit time. It is measured by an error performance analyzer (EPA). Figure 10 shows a schematic of the BER measurement circuit.
Figure 10.Bit error rate measurement setup. EPA, error performance analyzer; ED, error detector; PUT, process under test; SUT, signal under test; VOA, variable optical attenuator; PD, photodiode.
The EPA introduces a data pattern to the input signal. The SUT is obtained as a result of the PUT acting on the input signal; then, it is photodetected and fed back to the EPA, which measures the BER by comparing the transmitted and received bits. This process is repeated for different values of average SUT power.
The SUT power (optical power at point 1 in Fig. 10) is varied by acting on a variable optical attenuator ( in Fig. 10). An erbium-doped fiber amplifier (EDFA) ensures that the received power (optical power at point 2 in Fig. 10) is always equal to 0 dBm. This way, measurements with lower SUT power correspond to higher values of amplified spontaneous emission noise from the EDFA. The measured average SUT power (with 0 dBm received optical power at point 2 in Fig. 10) represents then a metric for the optical signal-to-noise ratio of the measurement.
In the back-to-back (B2B) configuration, the PUT is not present, and the SUT is only affected by the BER measurement process itself. This serves as a point of comparison to study system performance.
B. -Factor
The eye diagram representation of a digital data signal is a superposition of consecutive symbol intervals (periods) of the sequence. This representation is a powerful tool for evaluation of the combined effects of noise and inter-symbol interference, since it contains a combination of all possible realizations of the digital modulation sequence.
The factor is measured in the eye diagram, as a metric of the eye aperture, where and are the average optical power on the top and bottom eye levels, respectively, and and are their standard deviations.
The eye factor is evaluated following a protocol identical to that used to characterize the BER, from eye diagram measurements of the SUT, recorded by a 500 GHz effective bandwidth optical sampling oscilloscope.
Acknowledgment
Acknowledgment. The authors thank Tektronix (in particular, Mr. Richard Duhamel) and Prof. Sophie LaRochelle for lending part of the electronics used in the experiments. The authors are also grateful to Prof. Lei Lei for fruitful discussions and help with preliminary experimental tests and to Mr. Robin Helsten for providing technical assistance.
References
[1] B. Sklar. Digital Communications Fundamentals and Applications(2001).
[2] A data pulse sequence follows a nonreturn-to-zero (NRZ) coding format when temporal duration of the pulses is fixed to coincide with the inter-symbol period, so that there are no guard times between consecutive symbols. When the pulse duration is shorter than the inter-symbol period, the sequence follows a return-to-zero (RZ) coding format, leaving guard times between consecutive symbols.
[31] Before each electro-optical modulator, a tunable optical delay line and a polarization controller are connected in order to align the voltage drive to the optical signal and to maximize the modulation efficiency. Additionally, RF amplifiers were used to boost the voltage drive signals of each electro-optical modulator.
[32] G. P. Agrawal. Fiber-Optic Communication Systems(2002).
[33] W. Freude, R. Schmogrow, B. Nebendahl, M. Winter, A. Josten, D. Hillerkuss, S. Koenig, J. Meyer, M. Dreschmann, M. Huebner, C. Koos, J. Becker, J. Leuthold. Quality metrics for optical signals: eye diagram, Q-factor, OSNR, EVM and BER. 14th International Conference on Transparent Optical Networks, Mo.B1.5(2012).