Author Affiliations
School of Science, Xi’an University of Architecture and Technology, Xi’an, Shaanxi 710055, Chinashow less
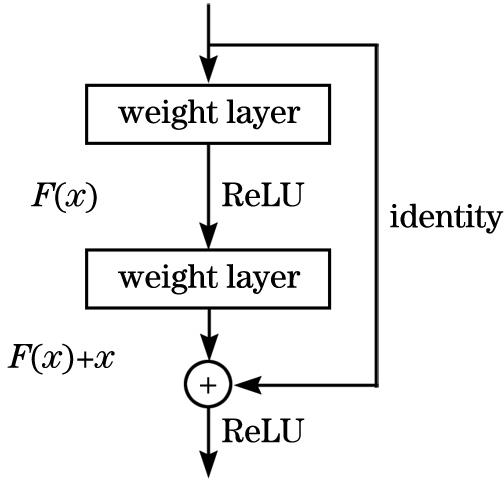
Fig. 1. Structure of residual learning model
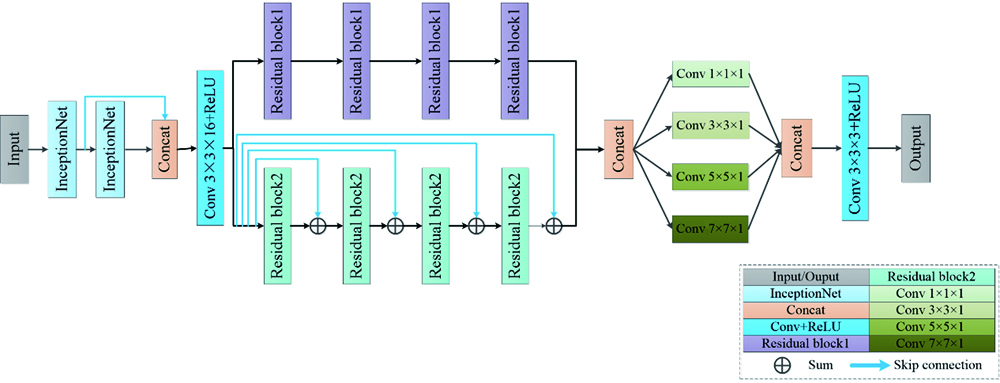
Fig. 2. Structure of parallel residual network model
Fig. 3. InceptionNet V1 network structure used in this paper
Fig. 4. Alternating residual model and local global residual model
Fig. 5. Comparison of subjective visual results for different combinations of loss functions
Fig. 6. Comparision of subjective visual results between our algorithm and seven contrast algorithms on real dataset
Fig. 7. Comparision of subjective visual results between our algorithm and seven contrast algorithms on synthetic dataset
Fig. 8. Comparison of subjective visual results of different algorithms on low-illumination images without contrast map
Fig. 9. Three comparative model structures
Fig. 10. Comparison of subjective visual results of four model structures
Loss | PSNR | SSIM |
---|
L'1 | 23.039 | 0.7947 | L'2 | 24.833 | 0.8269 | L'3 | 27.149 | 0.8434 | L'4 | 27.375 | 0.8807 |
|
Table 1. Calculation results of PSNR and SSIM for different combinations of loss functions
Image | Evaluation index | Method |
---|
SSR | MSRCR | Ying | Ren | BIMEF | LIME | Li | Our |
---|
Image1 | PSNR /dB | 12.059 | 17.844 | 14.412 | 11.884 | 18.412 | 21.345 | 20.447 | 28.331 | SSIM | 0.6013 | 0.5794 | 0.5969 | 0.6835 | 0.6469 | 0.7898 | 0.7259 | 0.8997 | Image2 | PSNR/dB | 13.469 | 14.007 | 20.891 | 14.558 | 14.829 | 23.968 | 22.424 | 31.087 | SSIM | 0.5974 | 0.5743 | 0.7559 | 0.8232 | 0.6001 | 0.8559 | 0.7068 | 0.9365 | Image3 | PSNR/dB | 18.612 | 21.041 | 15.982 | 10.920 | 11.706 | 17.700 | 21.346 | 30.112 | SSIM | 0.7810 | 0.7346 | 0.8321 | 0.6560 | 0.6826 | 0.7209 | 0.7881 | 0.9331 | Image4 | PSNR/dB | 15.931 | 13.706 | 20.5662 | 14.780 | 15.394 | 24.355 | 17.858 | 25.914 | SSIM | 0.6581 | 0.4831 | 0.6405 | 0.6504 | 0.5674 | 0.8334 | 0.6849 | 0.8343 |
|
Table 2. PSNR and SSIM of our algorithm and seven contrast algorithms on real dataset
Image | Evaluation index | Method |
---|
SSR | MSRCR | Ying | Li | Ren | BIMEF | LIME | Our |
---|
Image1 | PSNR /dB | 11.841 | 13.085 | 19.501 | 17.415 | 13.601 | 13.863 | 26.417 | 29.053 | SSIM | 0.6656 | 0.6802 | 0.7273 | 0.7778 | 0.5221 | 0.7088 | 0.8363 | 0.8416 | Image2 | PSNR /dB | 11.253 | 11.674 | 22.293 | 19.002 | 15.951 | 16.218 | 23.830 | 29.959 | SSIM | 0.6031 | 0.6240 | 0.7887 | 0.8049 | 0.6541 | 0.7653 | 0.8323 | 0.8746 | Image3 | PSNR /dB | 9.8805 | 10.946 | 21.450 | 16.578 | 17.093 | 20.704 | 20.307 | 26.423 | SSIM | 0.5483 | 0.5690 | 0.6863 | 0.6675 | 0.4814 | 0.7687 | 0.7725 | 0.8073 | Image4 | PSNR /dB | 12.746 | 13.868 | 15.871 | 15.769 | 11.287 | 11.613 | 20.699 | 26.085 | SSIM | 0.5681 | 0.6006 | 0.6715 | 0.7619 | 0.4996 | 0.6513 | 0.8129 | 0.8318 |
|
Table 3. PSNR and SSIM of our algorithm and seven contrast algorithms on synthetic dataset
Method | Evaluation index | NRSS | NIQE |
---|
Image1 | Image2 | Image3 | Average | Image1 | Image2 | Image3 | Average | Image1 | Image2 | Image3 | Average |
---|
SSR | 6.3635 | 7.0093 | 7.0177 | 6.7968 | 0.4208 | 0.6408 | 0.4511 | 0.5042 | 21.543 | 30.237 | 28.735 | 26.838 | MSRCR | 6.2553 | 7.1503 | 7.1858 | 6.8305 | 0.4168 | 0.6437 | 0.4847 | 0.4125 | 21.173 | 23.282 | 13.111 | 19.189 | Ying | 4.9771 | 6.4808 | 6.8622 | 6.8638 | 0.2963 | 0.5007 | 0.4406 | 0.5151 | 9.352 | 11.769 | 9.21 | 10.11 | Li | 4.7706 | 5.6065 | 6.5899 | 5.6557 | 0.3614 | 0.4961 | 0.3948 | 0.4174 | 11.513 | 12.074 | 9.927 | 11.171 | Ren | 4.2115 | 5.6318 | 6.1182 | 5.3205 | 0.3559 | 0.3442 | 0.2184 | 0.3062 | 9.927 | 17.351 | 11.738 | 13.005 | BIMEF | 5.3003 | 6.4905 | 6.8105 | 6.2004 | 0.3445 | 0.6266 | 0.5277 | 0.4996 | 8.793 | 17.855 | 13.26 | 13.303 | LIME | 5.9361 | 6.274 | 7.153 | 6.4544 | 0.4394 | 0.6492 | 0.3226 | 0.4704 | 8.347 | 20.275 | 12.72 | 13.781 | Our | 6.5744 | 6.8264 | 7.0261 | 6.809 | 0.3772 | 0.6425 | 0.6024 | 0.5407 | 8.269 | 11.727 | 7.593 | 9.196 |
|
Table 4. Information entropy, NRSS and NIQE of low-illumination images without contrast map
Model | PSNR /dB | SSIM |
---|
Model1 | 29.552 | 0.9026 | Model2 | 29.564 | 0.9048 | Model3 | 27.942 | 0.8208 | Model4 | 26.147 | 0.8321 |
|
Table 5. PSNR and SSIM results of four network models
Image | Model |
---|
Model1 | Model2 | Model3 | Model4 |
---|
Synthetic image | 0.6572 | 0.8374 | 0.5982 | 0.6067 | Real image | 0.6497 | 0.8679 | 0.5889 | 0.6164 |
|
Table 6. Comparison of running time of four models for enhancement of single image