• Acta Optica Sinica
  • Vol. 40, Issue 16, 1611001 (2020)
Xuan Hu1 and Qikai Lu2、*
Author Affiliations
  • 1State Key Laboratory of Information Engineering in Surveying, Mapping and Remote Sensing, Wuhan University, Wuhan, Hubei 430079, China
  • 2Electronic Information School, Wuhan University, Wuhan, Hubei 430079, China
  • show less
    DOI: 10.3788/AOS202040.1611001 Cite this Article Set citation alerts
    Xuan Hu, Qikai Lu. Hyperspectral Image Classification Algorithm Based on Saliency Profile[J]. Acta Optica Sinica, 2020, 40(16): 1611001 Copy Citation Text show less
    Flowchart of classification algorithm
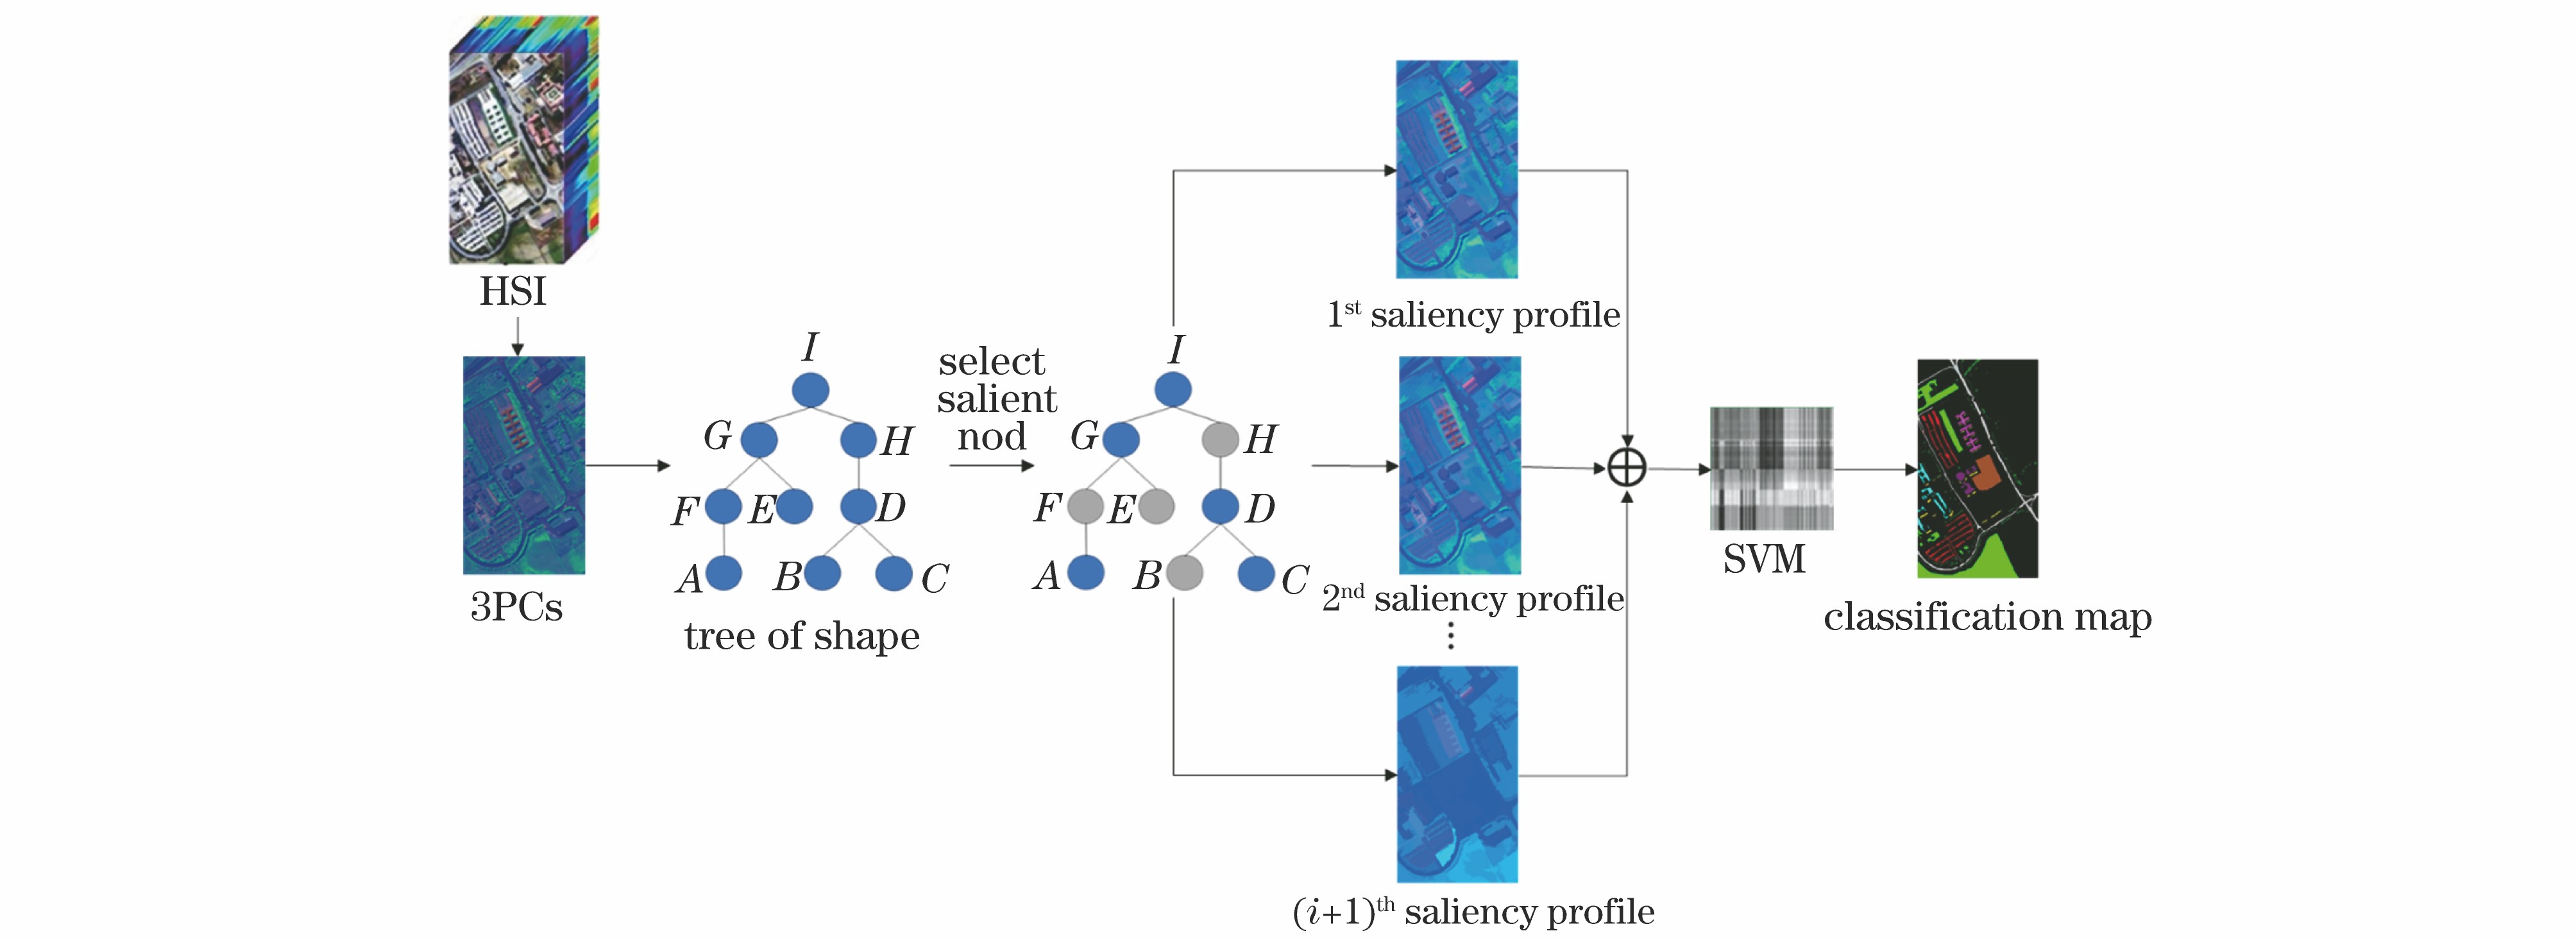
    Fig. 1. Flowchart of classification algorithm
    Tree structure of image. (a) Original image; (b) min-tree; (c) max-tree; (d) tree of shape
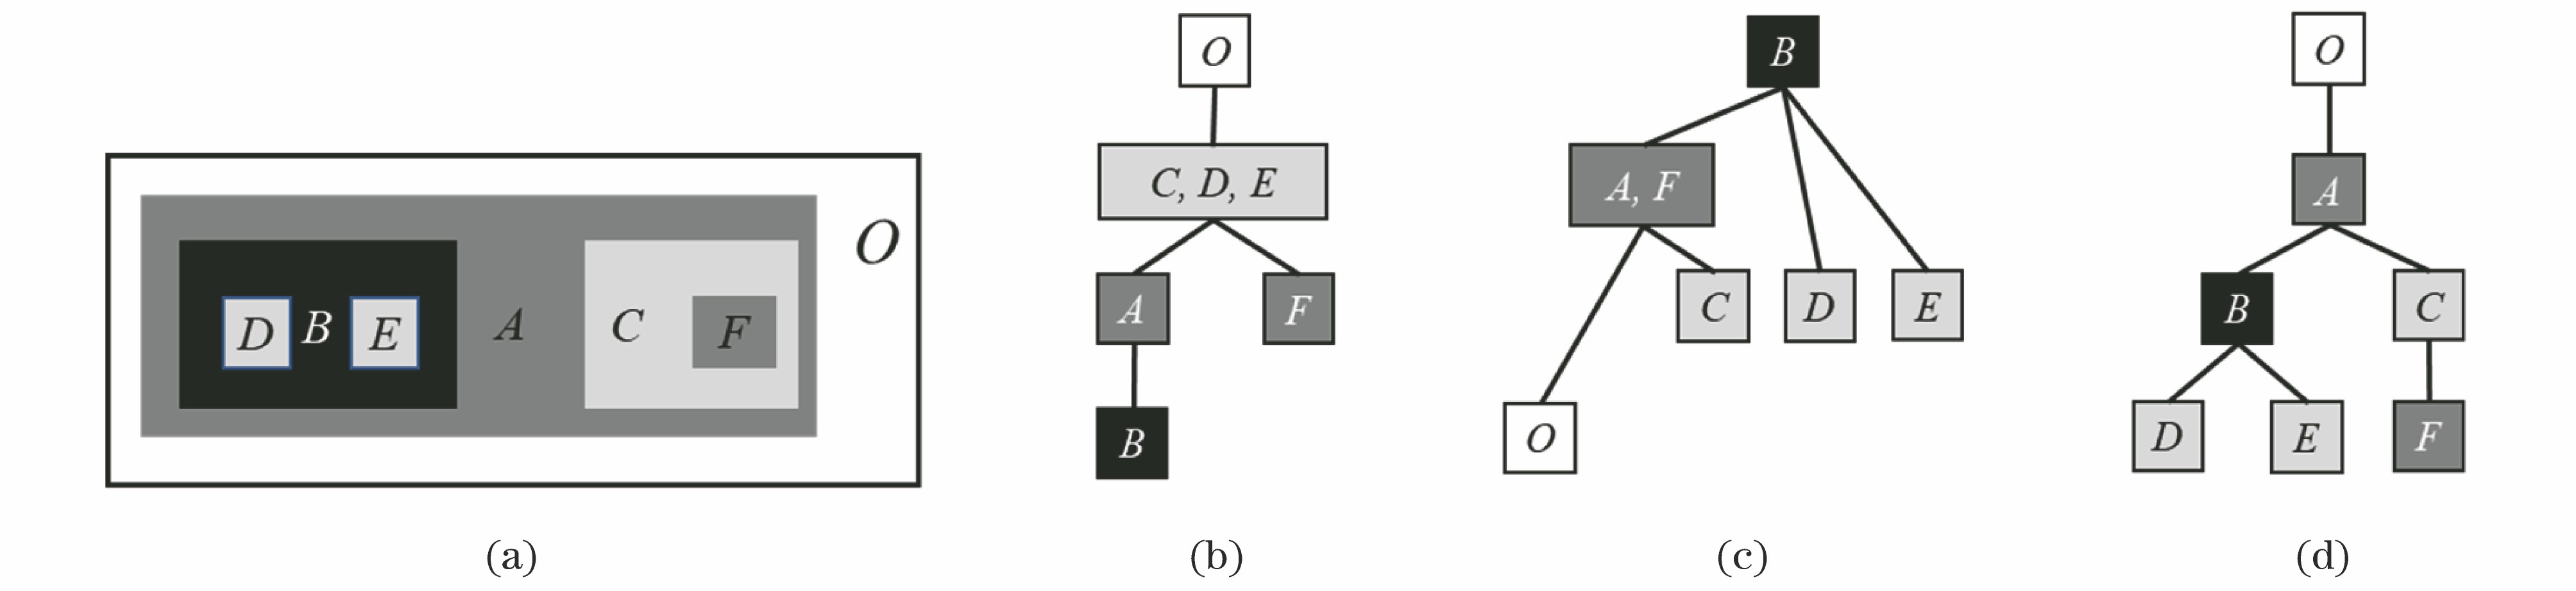
    Fig. 2. Tree structure of image. (a) Original image; (b) min-tree; (c) max-tree; (d) tree of shape
    Calculation process of node attributes. (a) Original image; (b) remove node B; (c) tree of shape before removing node B; (d) tree of shape after removing node B
    Fig. 3. Calculation process of node attributes. (a) Original image; (b) remove node B; (c) tree of shape before removing node B; (d) tree of shape after removing node B
    Real remote sensing image. (a) Sample images of Aν; (b)(c) change curves of A∇ and Aν from leaf node to root node; (d)(e) significant areas corresponding to two significant maximum points in Fig. (c)
    Fig. 4. Real remote sensing image. (a) Sample images of Aν; (b)(c) change curves of A and Aν from leaf node to root node; (d)(e) significant areas corresponding to two significant maximum points in Fig. (c)
    Hyperspectral images of Indian Pines dataset. (a) False color composite image; (b) survey results of feature types
    Fig. 5. Hyperspectral images of Indian Pines dataset. (a) False color composite image; (b) survey results of feature types
    Hyperspectral images of Pavia university dataset. (a) False color composite image; (b) survey results of feature types
    Fig. 6. Hyperspectral images of Pavia university dataset. (a) False color composite image; (b) survey results of feature types
    Classification results of different algorithms on Indian Pines dataset. (a) SVM; (b) EMP; (c) EMAP; (d) EEP; (e) SC-MK; (f) ESP
    Fig. 7. Classification results of different algorithms on Indian Pines dataset. (a) SVM; (b) EMP; (c) EMAP; (d) EEP; (e) SC-MK; (f) ESP
    Classification results of different algorithms on Pavia university dataset. (a) SVM; (b) EMP; (c) EMAP; (d) EEP; (e) SC-MK; (f) ESP
    Fig. 8. Classification results of different algorithms on Pavia university dataset. (a) SVM; (b) EMP; (c) EMAP; (d) EEP; (e) SC-MK; (f) ESP
    SP of different feature images on Pavia university dataset. (a) Original image; (b) SP0; (c) SP1; (d) SP2; (e) SP3; (f) SP4; (g) SP5; (h) SP6; (i) SP7; (j) SP8; (k) SP9; (l) SP10
    Fig. 9. SP of different feature images on Pavia university dataset. (a) Original image; (b) SP0; (c) SP1; (d) SP2; (e) SP3; (f) SP4; (g) SP5; (h) SP6; (i) SP7; (j) SP8; (k) SP9; (l) SP10
    Relationship curves between hν and OA
    Fig. 10. Relationship curves between hν and OA
    No.NameNumber of samples
    1Corn-notill1428
    2Corn-mintill830
    3Grass-pasture483
    4Grass-tree730
    5Hay-windrow478
    6Soybean-notill972
    7Soybean-mintill2455
    8Soybean-clean593
    9Wood1265
    10Building-grass-tree-drive386
    Total9620
    Table 1. Number of samples in Indian Pines dataset
    No.NameNumber of samples
    1Asphalt6631
    2Meadow18649
    3Gravel2099
    4Tree3064
    5Painted metal sheet1345
    6Bare soil5029
    7Bitumen1330
    8Self-blocking brick3682
    9Shadow947
    Total42776
    Table 2. Number of samples in Pavia university dataset
    ClassSVMEMPEMAPEEPSC-MKESP
    166.9970.2976.7979.3081.0092.54
    267.5970.9278.6079.2887.7894.88
    391.4890.8191.3492.2495.6197.71
    493.7194.8196.6597.4097.3299.94
    599.4499.3999.6599.5199.98100.00
    674.3269.9282.6684.3985.8094.08
    755.8960.6472.6774.0277.0991.86
    872.6967.6674.9979.9688.0393.08
    984.3285.8892.9193.7994.0499.10
    1073.2779.5892.7794.8894.6798.87
    OA /%72.4174.2082.3383.8886.5095.00
    AA /%77.9778.9985.9087.4890.1396.20
    K68.3870.4079.6381.4284.4094.19
    Table 3. Classification accuracy of Indian Pines dataset
    ClassSVMEMPEMAPEEPSC-MKESP
    193.7698.1793.4694.4895.3798.27
    294.4898.4790.8895.7995.6297.65
    367.7273.8589.4797.4097.7696.10
    481.8796.8697.0798.7996.3486.84
    595.7898.8999.2099.5299.9699.82
    662.6685.0395.6896.6597.7899.99
    760.3694.6697.3897.6299.95100.00
    881.1992.5185.9797.1694.8497.65
    999.5399.69100.0098.1399.9998.22
    OA /%84.2494.4392.4496.7696.2897.33
    AA /%79.7292.7694.3597.5397.5197.17
    K82.5293.0190.1295.6895.1196.45
    Table 4. Classification accuracy of Pavia university dataset
    Feature mapNumber of scale shapes
    Original image53653
    SP02259
    SP11072
    SP2645
    SP3416
    SP4242
    SP5170
    SP6120
    SP7103
    SP885
    SP960
    SP1041
    Table 5. Comparison of number of scale shapes of different feature images
    Xuan Hu, Qikai Lu. Hyperspectral Image Classification Algorithm Based on Saliency Profile[J]. Acta Optica Sinica, 2020, 40(16): 1611001
    Download Citation