• Infrared and Laser Engineering
  • Vol. 50, Issue 5, 20200437 (2021)
Miao Yu1, Mingyang Sun2, Yaolu Zhang2, Yutong He1, and Zhifeng Zheng3
Author Affiliations
  • 1School of Electronic Information Engineering, Zhongshan Institute, University of Electronic Science and Technology of China, Zhongshan 528402, China
  • 2College of Instrumentation & Electrical Engineering, Jilin University, Changchun 130012, China
  • 3Zhuhai Pegasus Optoelectronics Technology Co., Ltd., Zhuhai 519000, China
  • show less
    DOI: 10.3788/IRLA20200437 Cite this Article
    Miao Yu, Mingyang Sun, Yaolu Zhang, Yutong He, Zhifeng Zheng. Phase ambiguity and unwrapping of phase-sensitive optical time-domain reflectometer[J]. Infrared and Laser Engineering, 2021, 50(5): 20200437 Copy Citation Text show less
    Sensing principle diagram of 传感原理图
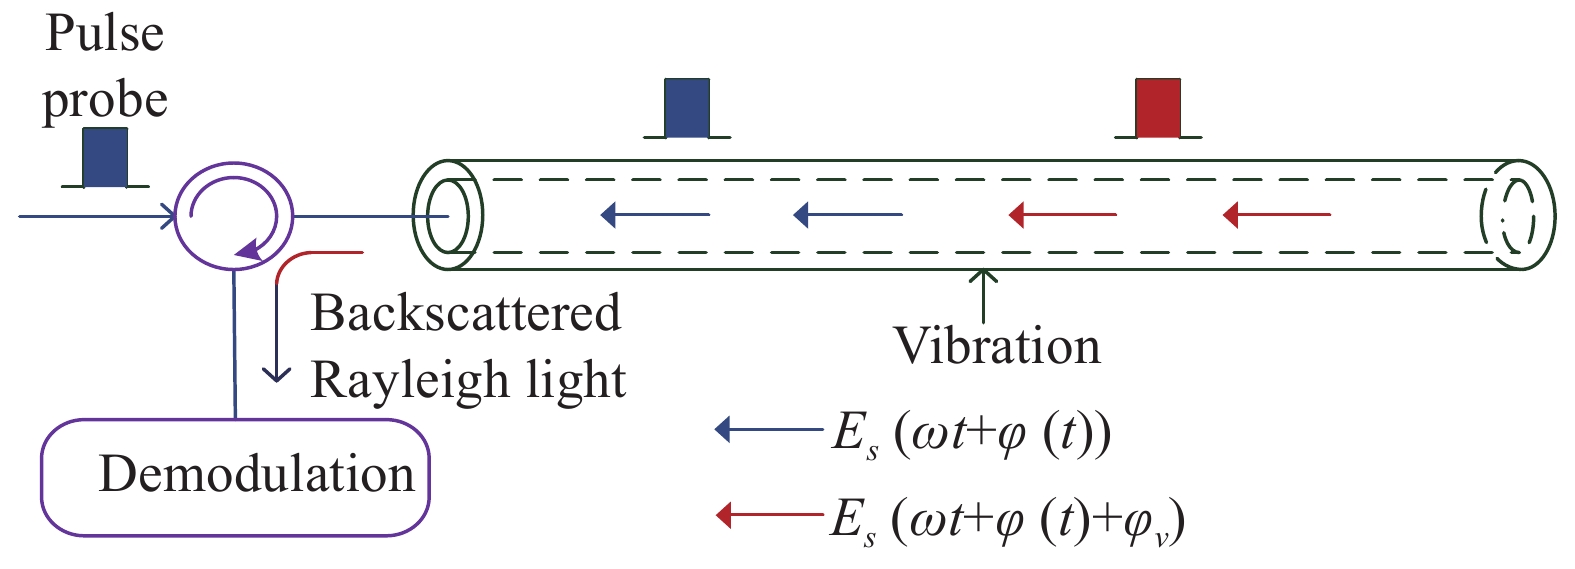
    Fig. 1. Sensing principle diagram of 传感原理图
    Experiment setup
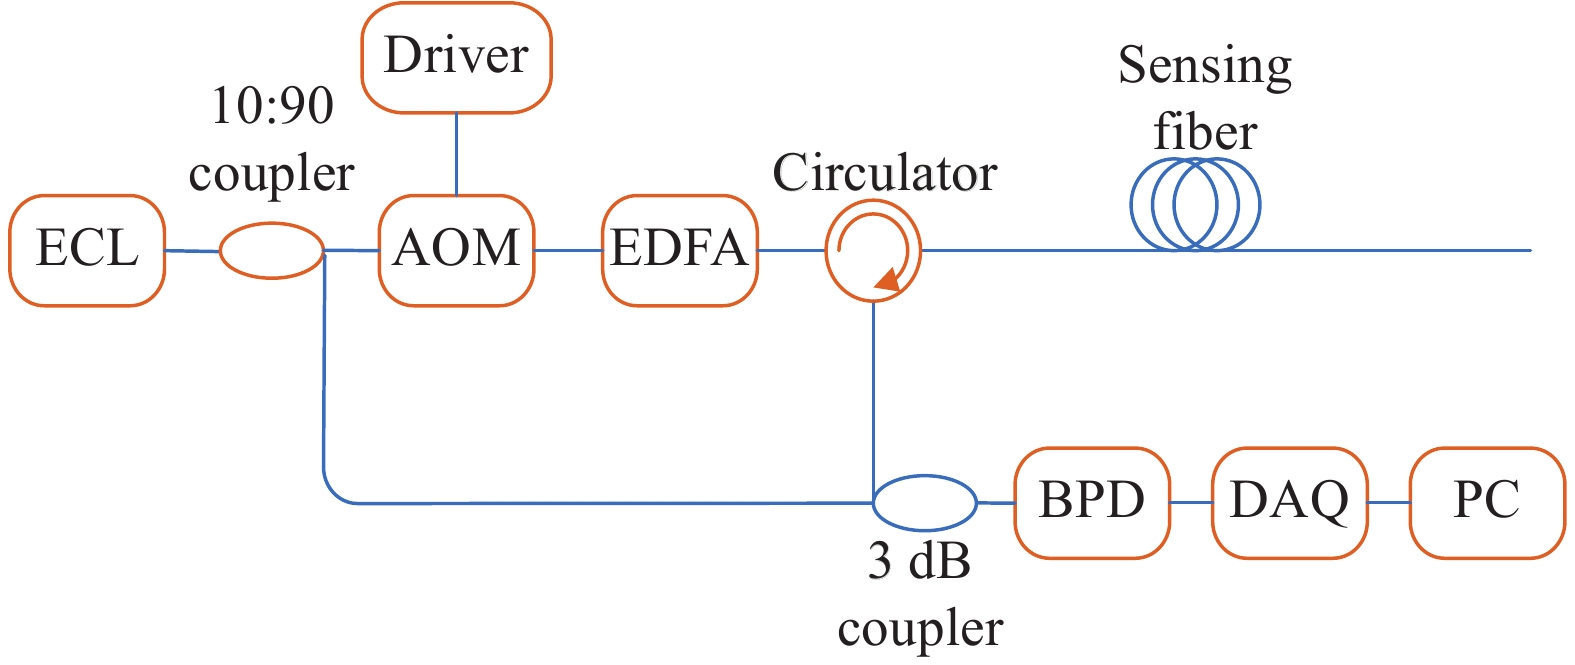
    Fig. 2. Experiment setup
    Quadrant distribution diagram of ,and in the period of ,和在周期内象限分布图
    Fig. 3. Quadrant distribution diagram of , and in the period of , 和 在 周期内象限分布图
    (a) 200 curves of direct phase demodulation result; (b) Phase curves of eliminating initial phase interference; (c) Phase curves after first unwrapping; (d) Distance-time curves of phase difference
    Fig. 4. (a) 200 curves of direct phase demodulation result; (b) Phase curves of eliminating initial phase interference; (c) Phase curves after first unwrapping; (d) Distance-time curves of phase difference
    (a) Distance-time curves of phase difference after second unwrapping; (b) Phase vs time curves of phase confusion position before and after second unwrapping; (c) Phase difference curves; (d) Phase vs time curves of before and after second unwrapping at 4 804 m
    Fig. 5. (a) Distance-time curves of phase difference after second unwrapping; (b) Phase vs time curves of phase confusion position before and after second unwrapping; (c) Phase difference curves; (d) Phase vs time curves of before and after second unwrapping at 4 804 m
    (a)-(c) When 10, 800, 1500 Hz disturbance signals act respectively, phase vs time curves of before and after second unwrapping; (d) Spectrum diagram of system demodulation
    Fig. 6. (a)-(c) When 10, 800, 1500 Hz disturbance signals act respectively, phase vs time curves of before and after second unwrapping; (d) Spectrum diagram of system demodulation
    Phase change amplitude vs PZT driving voltage curve
    Fig. 7. Phase change amplitude vs PZT driving voltage curve
    Phase difference response curves at 5 305 m and 9 815 m
    Fig. 8. Phase difference response curves at 5 305 m and 9 815 m
    Region number in Fig.3$\sin (\phi (t))$$\cos (\phi (t))$$\phi (t) \in ( - \pi ,\pi )$
    <0<0$\arctan (Q/I) - \pi $
    <0>0$\arctan (Q/I)$
    >0>0$\arctan (Q/I)$
    >0<0$\arctan (Q/I) + \pi $
    Table 1. Specific implementation comparison table of value range expansion
    Miao Yu, Mingyang Sun, Yaolu Zhang, Yutong He, Zhifeng Zheng. Phase ambiguity and unwrapping of phase-sensitive optical time-domain reflectometer[J]. Infrared and Laser Engineering, 2021, 50(5): 20200437
    Download Citation