• Acta Optica Sinica
  • Vol. 40, Issue 12, 1201003 (2020)
Chuan Lin1、2、*, Renzhi Hu2、**, Pinhua Xie2、3、4、5、***, Shengyang Wu2, Jinzhao Tong2, Zhiyan Li6, Fengyang Wang2, and Yihui Wang2、4
Author Affiliations
  • 1Institutes of Physical Science and Information Technology, Anhui University, Hefei, Anhui 230601, China
  • 2Key Laboratory of Environmental Optics and Technology, Anhui Institute of Optics and Fine Mechanics, Chinese Academy of Sciences, Hefei, Anhui 230031, China
  • 3CAS Center for Excellence in Regional Atmospheric Environment, Xiamen, Fujian 361000, China
  • 4School of Environmental Science and Optoelectronic Technology, University of Science and Technology of China, Hefei, Anhui 230026, China
  • 5University of Chinese Academy of Sciences, Beijing 100049, China
  • 6School of Mathematics and Physics, Anhui University of Technology, Maanshan, Anhui 243002, China
  • show less
    DOI: 10.3788/AOS202040.1201003 Cite this Article Set citation alerts
    Chuan Lin, Renzhi Hu, Pinhua Xie, Shengyang Wu, Jinzhao Tong, Zhiyan Li, Fengyang Wang, Yihui Wang. Simultaneous Measurement of Nitrogen Dioxide and Organic Nitrate Based on Thermal Dissociation Cavity Ring-Down Spectroscopy[J]. Acta Optica Sinica, 2020, 40(12): 1201003 Copy Citation Text show less
    Schematic of the TD-CRDS system
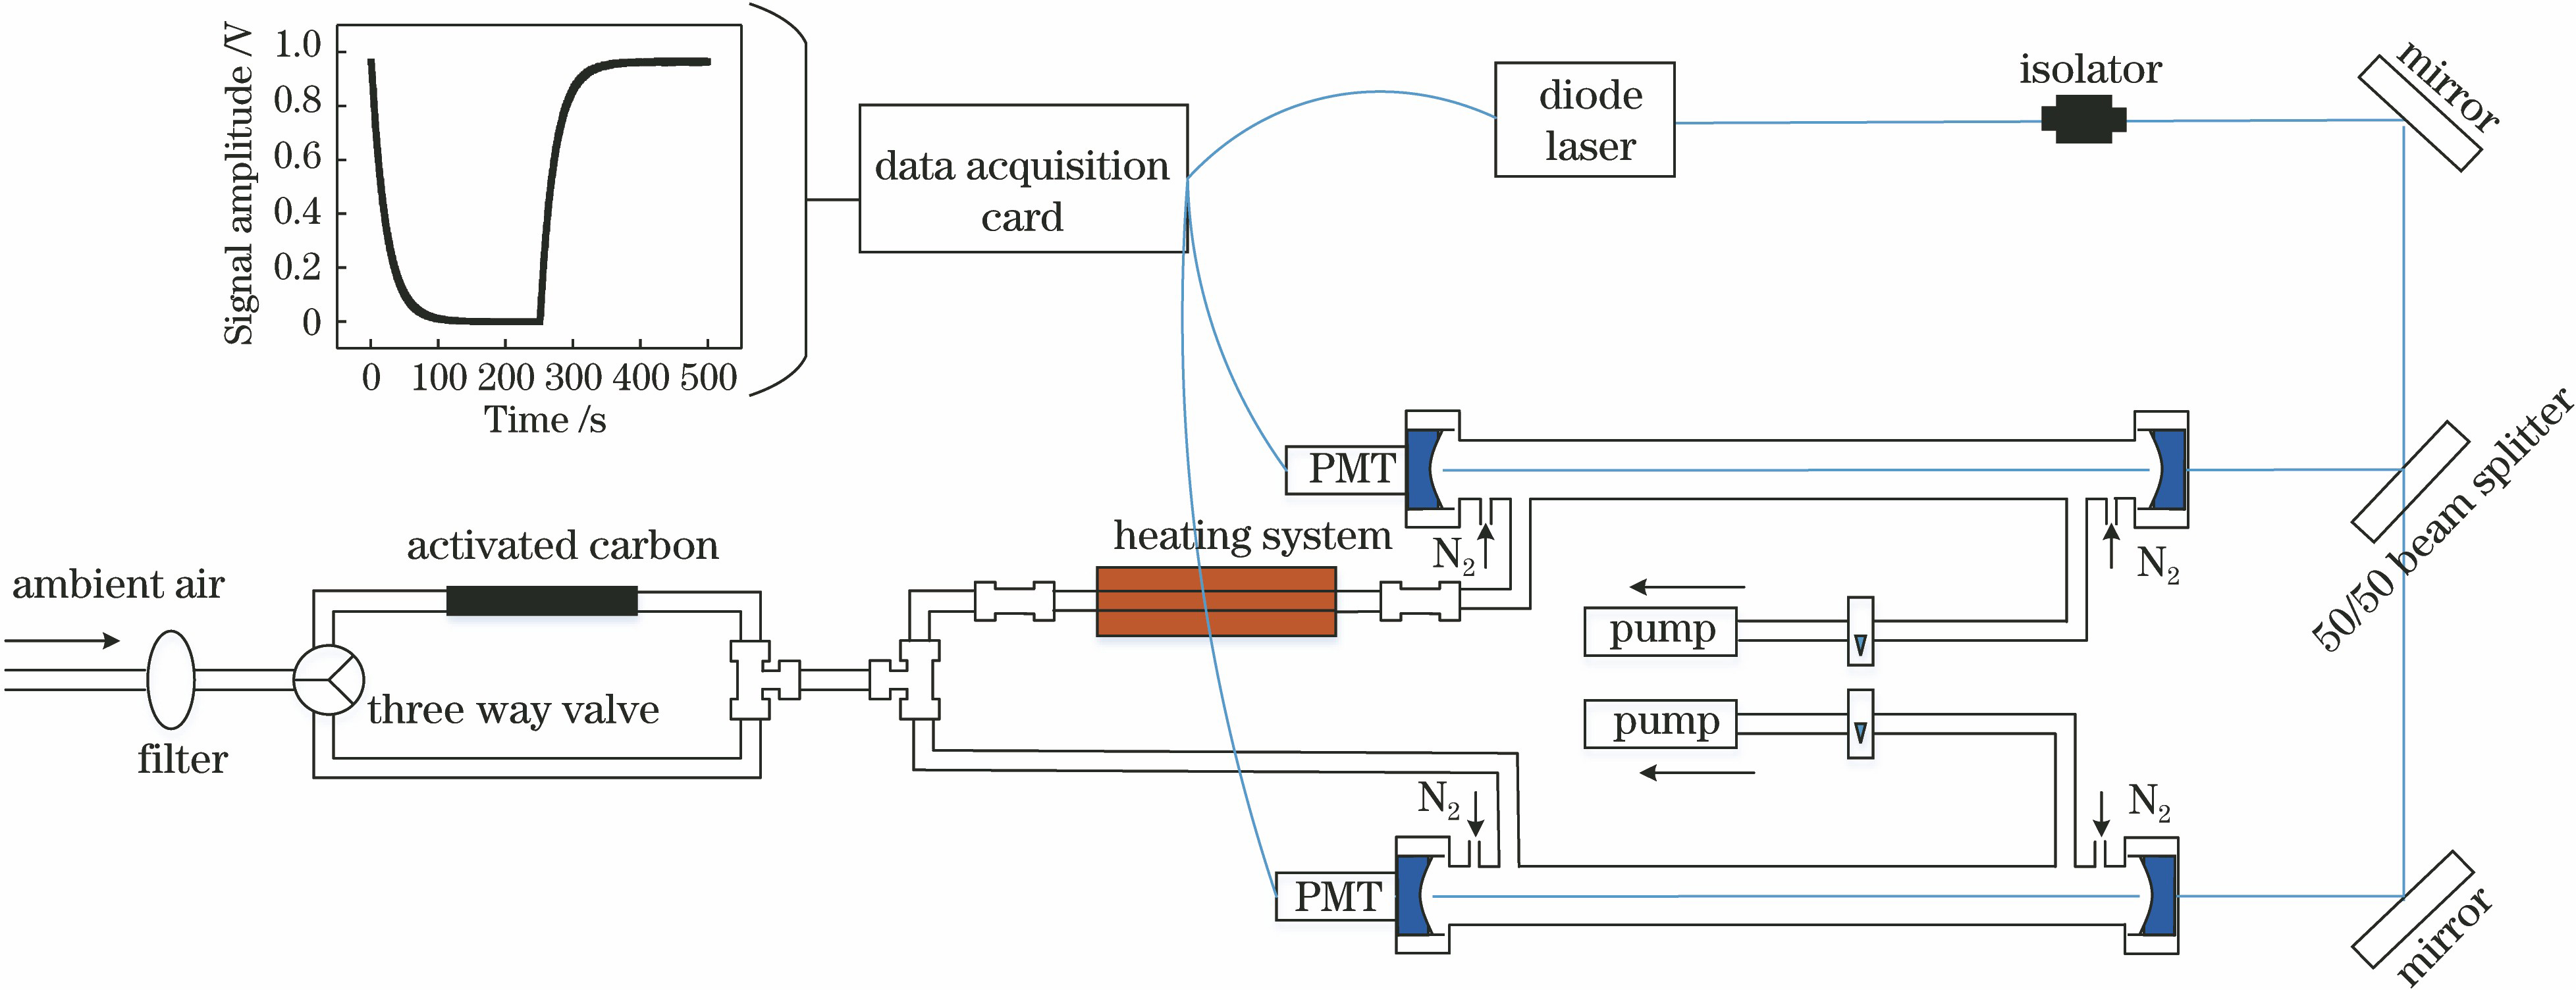
    Fig. 1. Schematic of the TD-CRDS system
    Cross section of NO2, O3, water vapour and diode laser spectrum. (a) Cross section of O3 and water vapour; (b) cross section of NO2 and diode laser spectrum
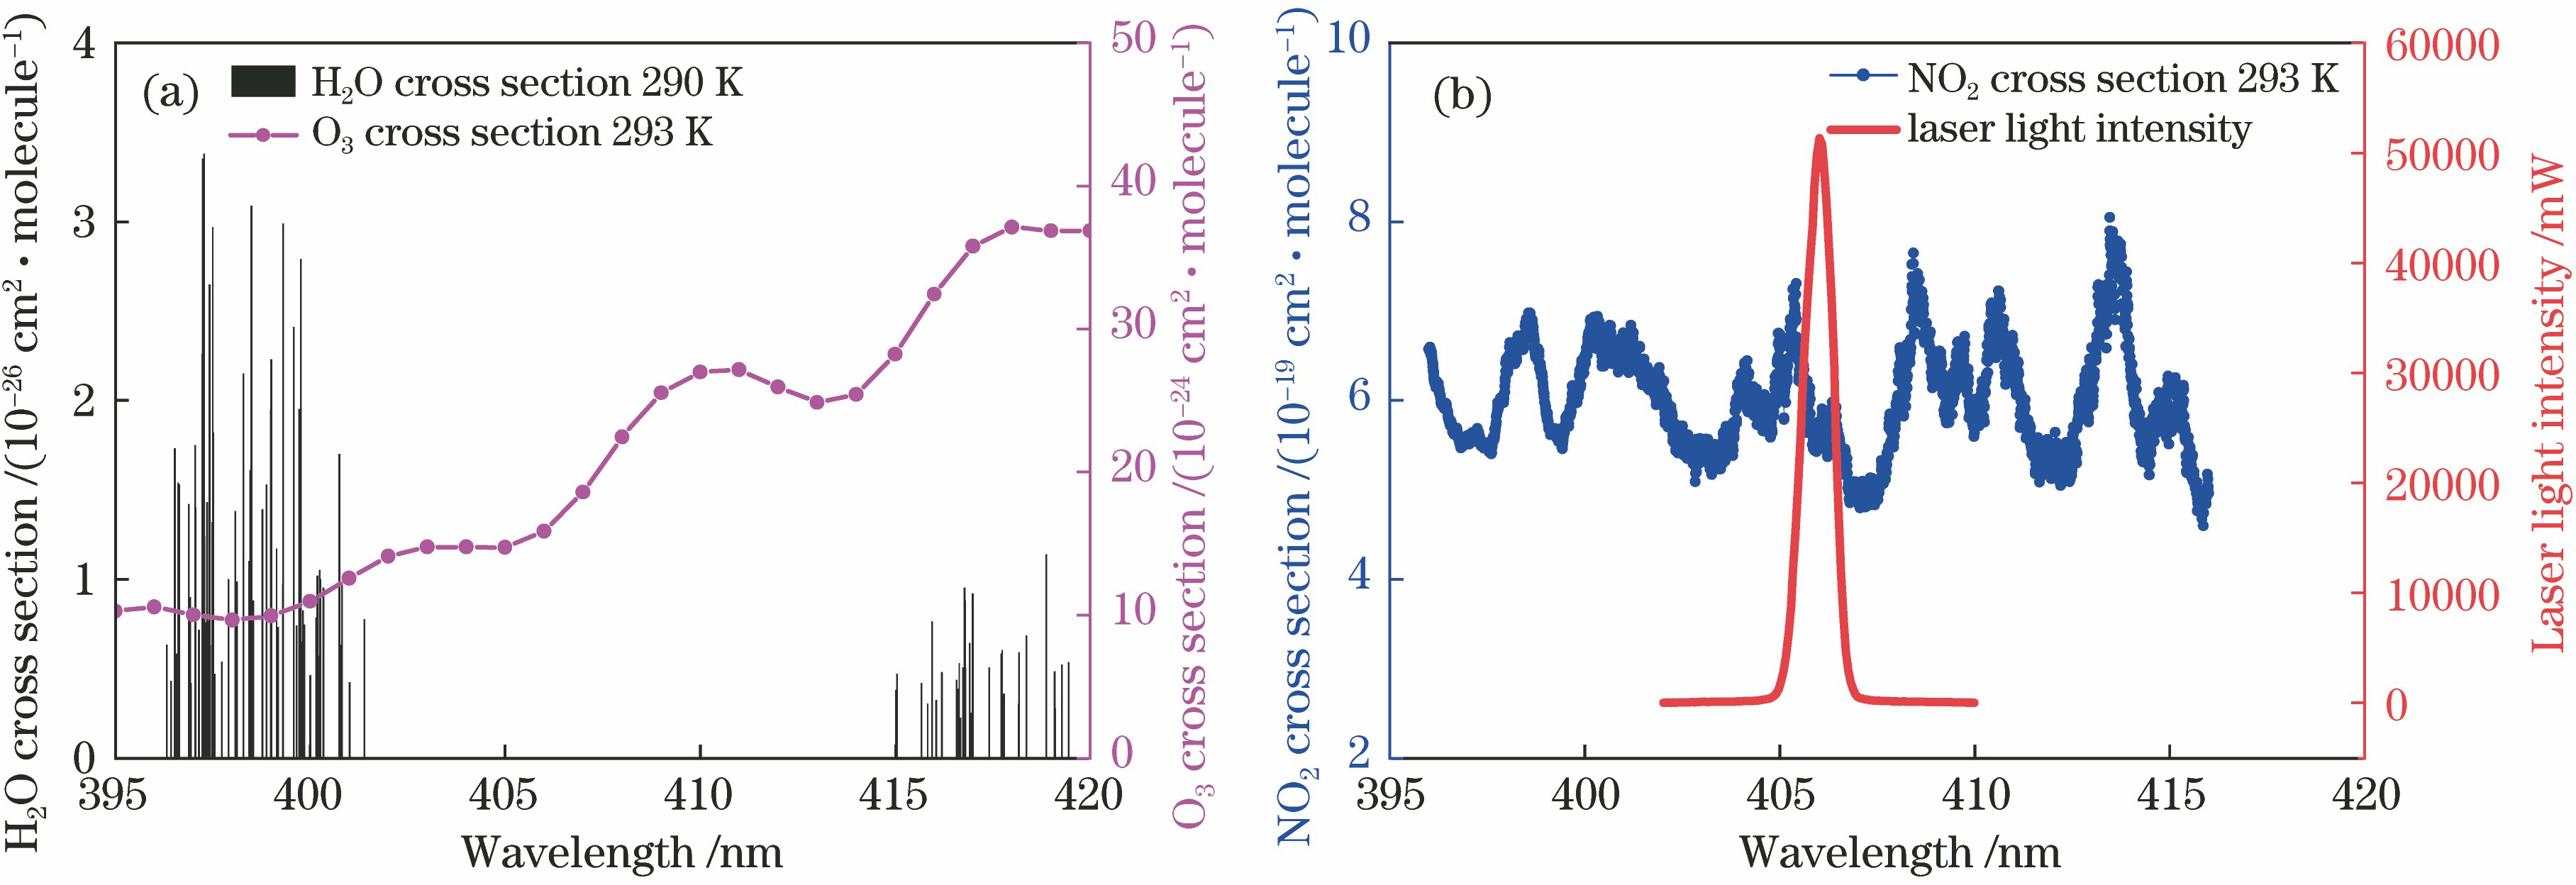
    Fig. 2. Cross section of NO2, O3, water vapour and diode laser spectrum. (a) Cross section of O3 and water vapour; (b) cross section of NO2 and diode laser spectrum
    Fitting results of cavity ring-down signal without NO2
    Fig. 3. Fitting results of cavity ring-down signal without NO2
    Temperature distribution in quartz glass tube at flow rate of 1 L/min
    Fig. 4. Temperature distribution in quartz glass tube at flow rate of 1 L/min
    Temperature fluctuation at 450 ℃
    Fig. 5. Temperature fluctuation at 450 ℃
    Comparison of dual-channel consistency. (a) Time series of NO2 concentration between the two channels; (b) correlation plot between the data from two channels
    Fig. 6. Comparison of dual-channel consistency. (a) Time series of NO2 concentration between the two channels; (b) correlation plot between the data from two channels
    Detection limit of CRDS system. (a) Continuous of NO2 concentration sampled only under zero air; (b) Allan deviation plot for NO2 concentration in CRDS system, in which the minimum value equals the optimum integration time
    Fig. 7. Detection limit of CRDS system. (a) Continuous of NO2 concentration sampled only under zero air; (b) Allan deviation plot for NO2 concentration in CRDS system, in which the minimum value equals the optimum integration time
    Comparison of CRDS and LP-DOAS. (a) Time series of NO2 concentration sampled by CRDS and LP-DOAS; (b) correlation plot between the data from CRDS and LP-DOAS
    Fig. 8. Comparison of CRDS and LP-DOAS. (a) Time series of NO2 concentration sampled by CRDS and LP-DOAS; (b) correlation plot between the data from CRDS and LP-DOAS
    Time series of ON and NO2 concentration during October 16 to 23, 2019
    Fig. 9. Time series of ON and NO2 concentration during October 16 to 23, 2019
    Daily average variation during the observation
    Fig. 10. Daily average variation during the observation
    Chuan Lin, Renzhi Hu, Pinhua Xie, Shengyang Wu, Jinzhao Tong, Zhiyan Li, Fengyang Wang, Yihui Wang. Simultaneous Measurement of Nitrogen Dioxide and Organic Nitrate Based on Thermal Dissociation Cavity Ring-Down Spectroscopy[J]. Acta Optica Sinica, 2020, 40(12): 1201003
    Download Citation