• Acta Optica Sinica
  • Vol. 41, Issue 9, 0928003 (2021)
Jian Wang1, Tianxiang Cui2, Yi Wang3, and Lin Sun4、*
Author Affiliations
  • 1College of Information and Management Science, Henan Agricultural University, Zhengzhou, Henan 450046, China
  • 2College of Forestry, Nanjing Forestry University, Nanjing, Jiangsu 210042, China
  • 3Geovis Technology Co., Ltd., Beijing 101399, China
  • 4College of Geodesy and Geomatics, Shandong University of Science and Technology, Qingdao, Shandong 266590, China
  • show less
    DOI: 10.3788/AOS202141.0928003 Cite this Article Set citation alerts
    Jian Wang, Tianxiang Cui, Yi Wang, Lin Sun. Cloud Detection for GF-5 Visible-Shortwave Infrared Advanced Hyperspectral Image[J]. Acta Optica Sinica, 2021, 41(9): 0928003 Copy Citation Text show less
    Hyperspectral images of cloud detection areas (false color composite image of bands 110, 64, 44 in RGB, the red vector is the visually interpreted cloud boundary). (a) Image a; (b) image b; (c) image c; (d) image d
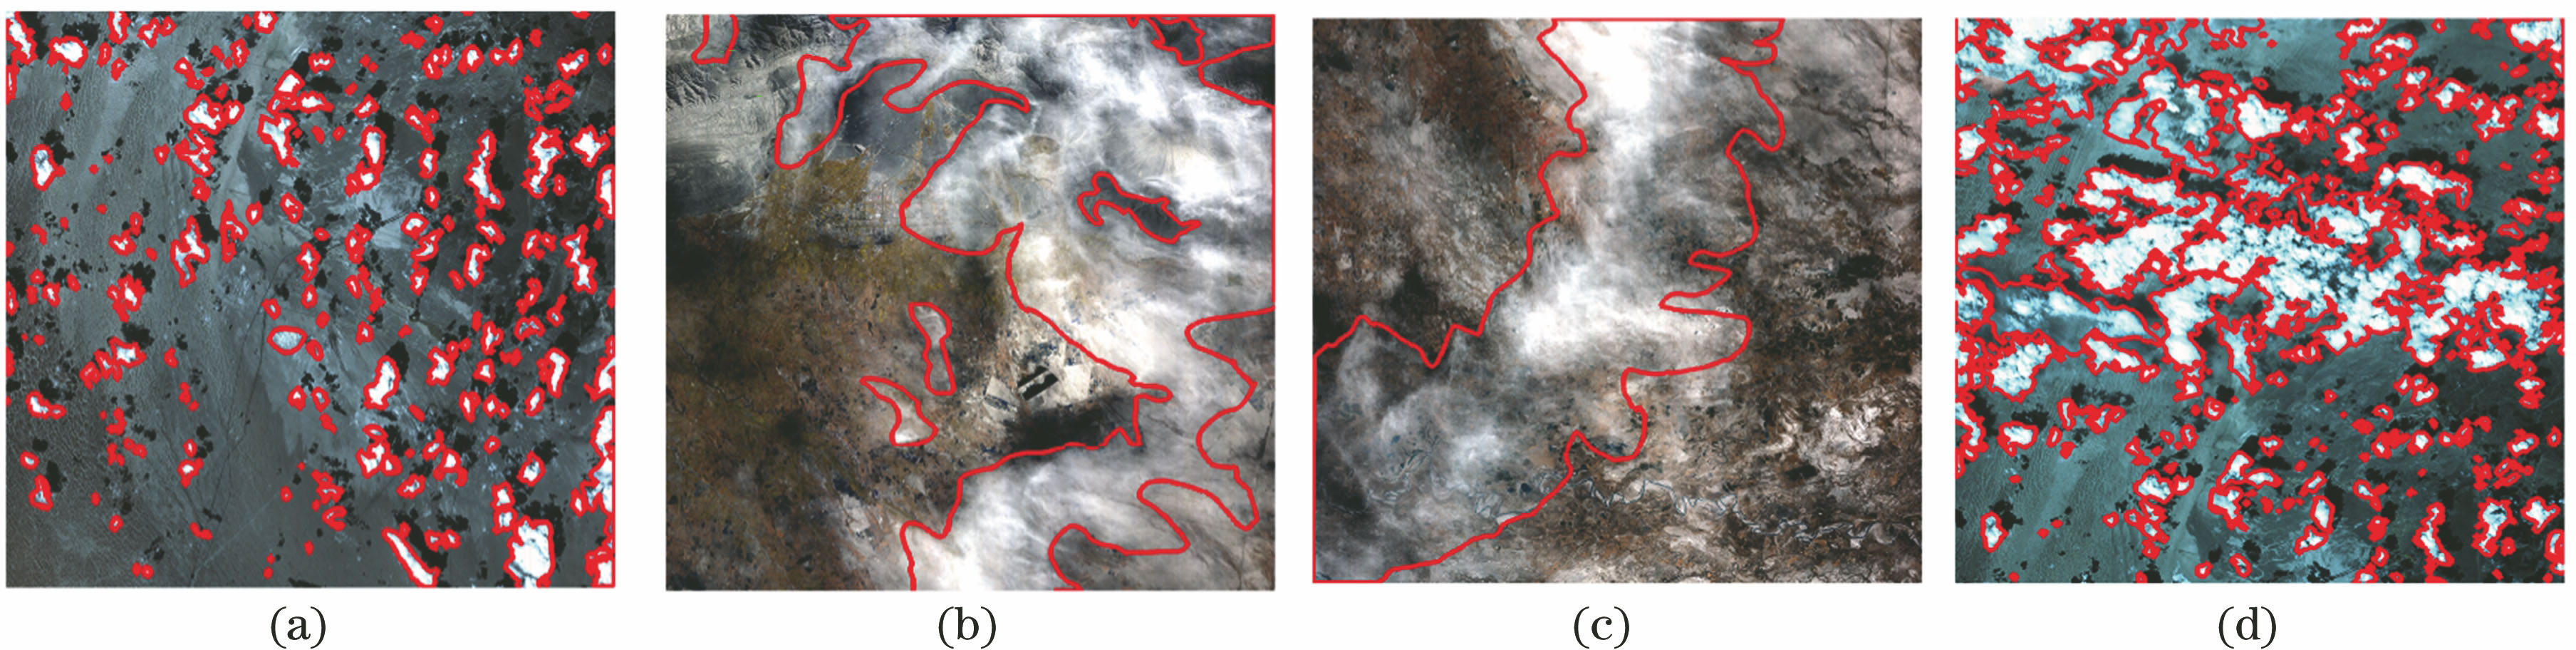
    Fig. 1. Hyperspectral images of cloud detection areas (false color composite image of bands 110, 64, 44 in RGB, the red vector is the visually interpreted cloud boundary). (a) Image a; (b) image b; (c) image c; (d) image d
    Apparent reflectance curves of different ground objects in AHSI hyperspectral image (the averages are shown as solid dots, and the error bars correspond to the standard deviations)
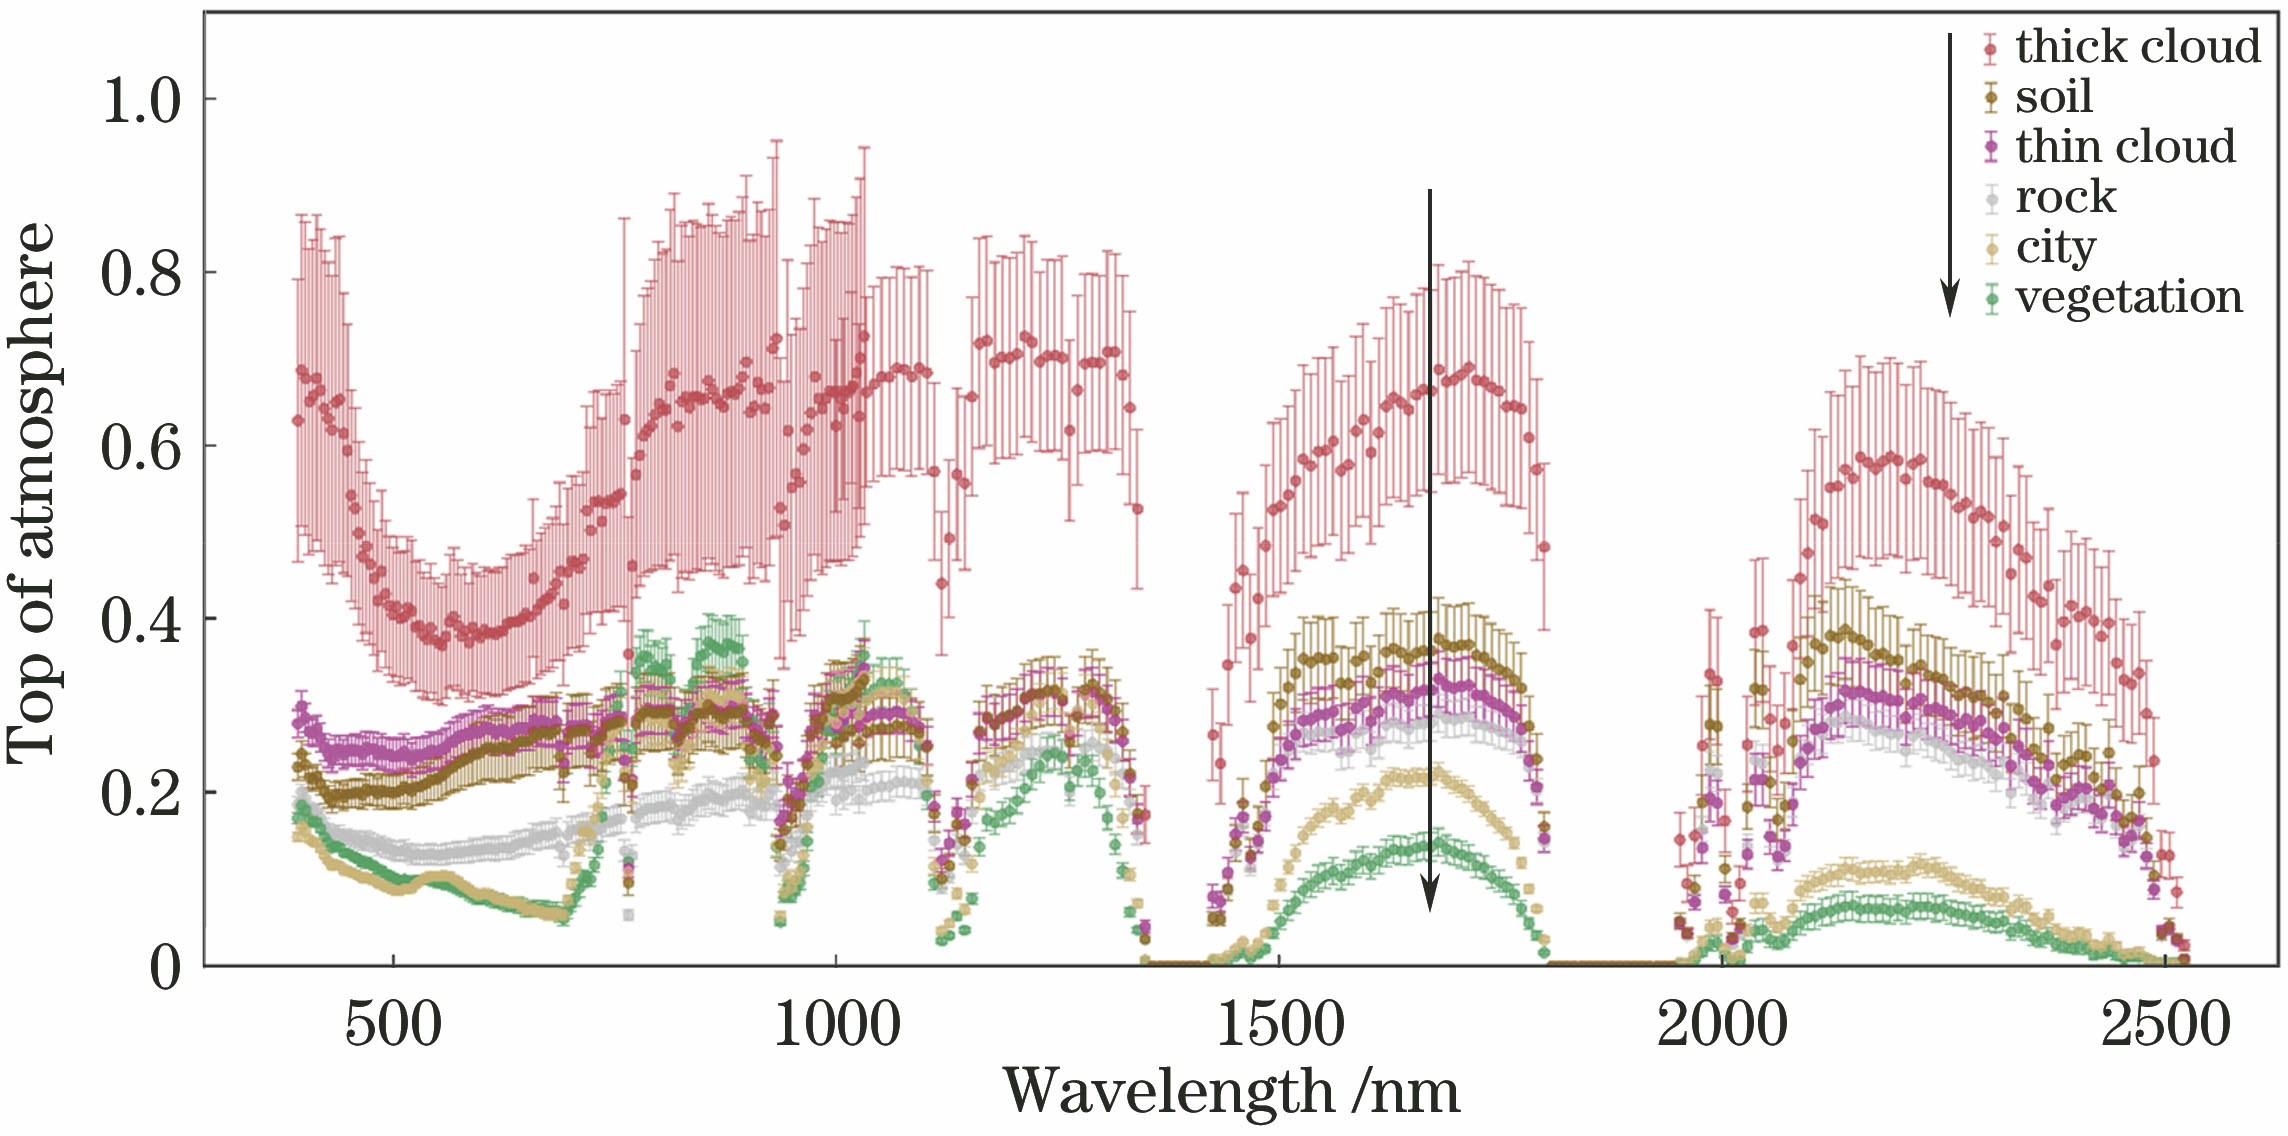
    Fig. 2. Apparent reflectance curves of different ground objects in AHSI hyperspectral image (the averages are shown as solid dots, and the error bars correspond to the standard deviations)
    Band ratio between different types ground objects in AHSI hyperspectral image. (a) Thin cloud; (b) soil; (c) rock
    Fig. 3. Band ratio between different types ground objects in AHSI hyperspectral image. (a) Thin cloud; (b) soil; (c) rock
    Cloud detection algorithm flow chart
    Fig. 4. Cloud detection algorithm flow chart
    Cloud detection results, white represents cloud, and the red vector is the visually interpreted cloud boundary. (a) Image a; (b) image b; (c) image c; (d) image d
    Fig. 5. Cloud detection results, white represents cloud, and the red vector is the visually interpreted cloud boundary. (a) Image a; (b) image b; (c) image c; (d) image d
    Local comparison of cloud detection results. (a1)(a2) False color image (using bands 110, 64, and 44 to represent the R, G, and B bands, respectively); (b) visual interpretation results, red labeled as cloud pixels; (c) detection results of our algorithm, green labeled as cloud pixels
    Fig. 6. Local comparison of cloud detection results. (a1)(a2) False color image (using bands 110, 64, and 44 to represent the R, G, and B bands, respectively); (b) visual interpretation results, red labeled as cloud pixels; (c) detection results of our algorithm, green labeled as cloud pixels
    InstrumentChannelSpectralrange /μmNumber ofbandsBandwidth /nmSwathwidth /kmSpatialresolution /m
    GF-5 AHSIVIS-NIR0.39-1.0041505
    SWIR1.01-2.51180106030
    EO-1 HyperionVIS-NIR0.356-1.0857010
    SWIR0.852-2.577172107.730
    Table 1. Comparison of parameters of GF-5 AHSI and EO-1 Hyperion
    SensorImageDatePath /rowLongitude /(°)Latitude /(°)Solar zenith /(°)
    a2019-04-08363/53088.844.839.35
    AHSIb2019-04-04377/62483.241.638.03
    c2019-04-04377/62383.341.237.61
    d2019-04-08363/63188.745.139.59
    Table 2. Cloud detection image parameters
    ImageProportion /%Overallaccuracy /%Producer'saccuracy /%User'saccuracy /%
    Visual interpretationOur algorithm
    a13.010.0957193
    b42.046.7899283
    c37.640.5939488
    d35.730.3907993
    Table 3. Statistics of cloud detection accuracy of our algorithm
    Jian Wang, Tianxiang Cui, Yi Wang, Lin Sun. Cloud Detection for GF-5 Visible-Shortwave Infrared Advanced Hyperspectral Image[J]. Acta Optica Sinica, 2021, 41(9): 0928003
    Download Citation