• Laser & Optoelectronics Progress
  • Vol. 58, Issue 3, 3300021 (2021)
Deng Yao1、2, Tang Wen3, Li Zhenghui1、2, Zhong Shangwen3, Zou Lichang1、2, Lu Zhimin1、2, Lin Jian3, and Yao Shunchun1、2、*
Author Affiliations
  • 1School of Electric Power, South China University of Technology, Guangzhou , Guangdong 510640, China
  • 2Guangdong Province Engineering Research Center of High Efficiency and Low Pollution Energy Conversion, Guangzhou , Guangdong 510640, China
  • 3Guangdong Red Bay Power Generation Co., Ltd., Shanwei , Guangdong 516626, China
  • show less
    DOI: 10.3788/LOP202158.0330002 Cite this Article Set citation alerts
    Deng Yao, Tang Wen, Li Zhenghui, Zhong Shangwen, Zou Lichang, Lu Zhimin, Lin Jian, Yao Shunchun. Gas Concentration Inversion Method Based on Calibration of Direct Absorption Peak Value[J]. Laser & Optoelectronics Progress, 2021, 58(3): 3300021 Copy Citation Text show less
    Line intensity of CO2, H2O, and O2 in the range from 6326.2 cm-1 to 6330.5 cm-1 at 296 K
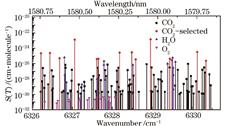
    Fig. 1. Line intensity of CO2, H2O, and O2 in the range from 6326.2 cm-1 to 6330.5 cm-1 at 296 K
    Simulated absorption spectra of CO2 in the range from 6326.2 cm-1 to 6330.5 cm-1 at 298 K and 101325 Pa
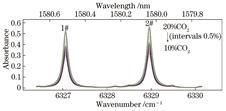
    Fig. 2. Simulated absorption spectra of CO2 in the range from 6326.2 cm-1 to 6330.5 cm-1 at 298 K and 101325 Pa
    A linear fitting between simulated absorption peak value and concentration
    Fig. 3. A linear fitting between simulated absorption peak value and concentration
    Variation of simulated absorption peak value with temperature
    Fig. 4. Variation of simulated absorption peak value with temperature
    Experimental setup
    Fig. 5. Experimental setup
    Reference light intensity obtained by the cubic polynomial of non-absorption area
    Fig. 6. Reference light intensity obtained by the cubic polynomial of non-absorption area
    Measured absorption spectra of each concentration of CO2 at 298 K
    Fig. 7. Measured absorption spectra of each concentration of CO2 at 298 K
    Calibration model of absorption peak value and concentration
    Fig. 8. Calibration model of absorption peak value and concentration
    Fitting curves between absorption peak value and temperature
    Fig. 9. Fitting curves between absorption peak value and temperature
    Comparison of absolute relative error of CO2 concentration by two methods
    Fig. 10. Comparison of absolute relative error of CO2 concentration by two methods
    True concentration/%Measured absorption peak valueMeasured concentration/%Absolute error/%Relative error/%
    100.28589.75-0.25-2.47
    120.360012.290.292.43
    140.411014.030.030.24
    160.470616.080.070.49
    180.522217.84-0.16-0.86
    200.581619.88-0.12-0.61
    Table 1. Concentration inverted by absorption peak value calibration model
    True concentration/%Measured results/%
    308 K318 K328 K338 K
    BeforeAfterBeforeAfterBeforeAfterBeforeAfter
    109.579.789.439.889.259.949.0510.00
    1211.7812.1311.4612.1311.0712.0410.7211.99
    1413.6314.1113.3414.2012.9214.1612.4614.07
    1615.4816.0815.0316.0714.6216.1214.1216.05
    1817.3118.0316.8618.1016.4918.2615.9618.25
    2019.1720.0218.7320.1718.1220.1417.6320.24
    Table 2. Inversion results of CO<sub>2</sub> concentration at different temperatures
    Deng Yao, Tang Wen, Li Zhenghui, Zhong Shangwen, Zou Lichang, Lu Zhimin, Lin Jian, Yao Shunchun. Gas Concentration Inversion Method Based on Calibration of Direct Absorption Peak Value[J]. Laser & Optoelectronics Progress, 2021, 58(3): 3300021
    Download Citation