
Hong Jia, Chujun Zheng, Canbiao Li, Wenbin Wang, Yanbing Xu. Retinal Blood Vessel Segmentation Based on Fuzzy C-Means Clustering According to the Local Line Structural Constraints[J]. Acta Optica Sinica, 2020, 40(9): 0910001
- Acta Optica Sinica
- Vol. 40, Issue 9, 0910001 (2020)
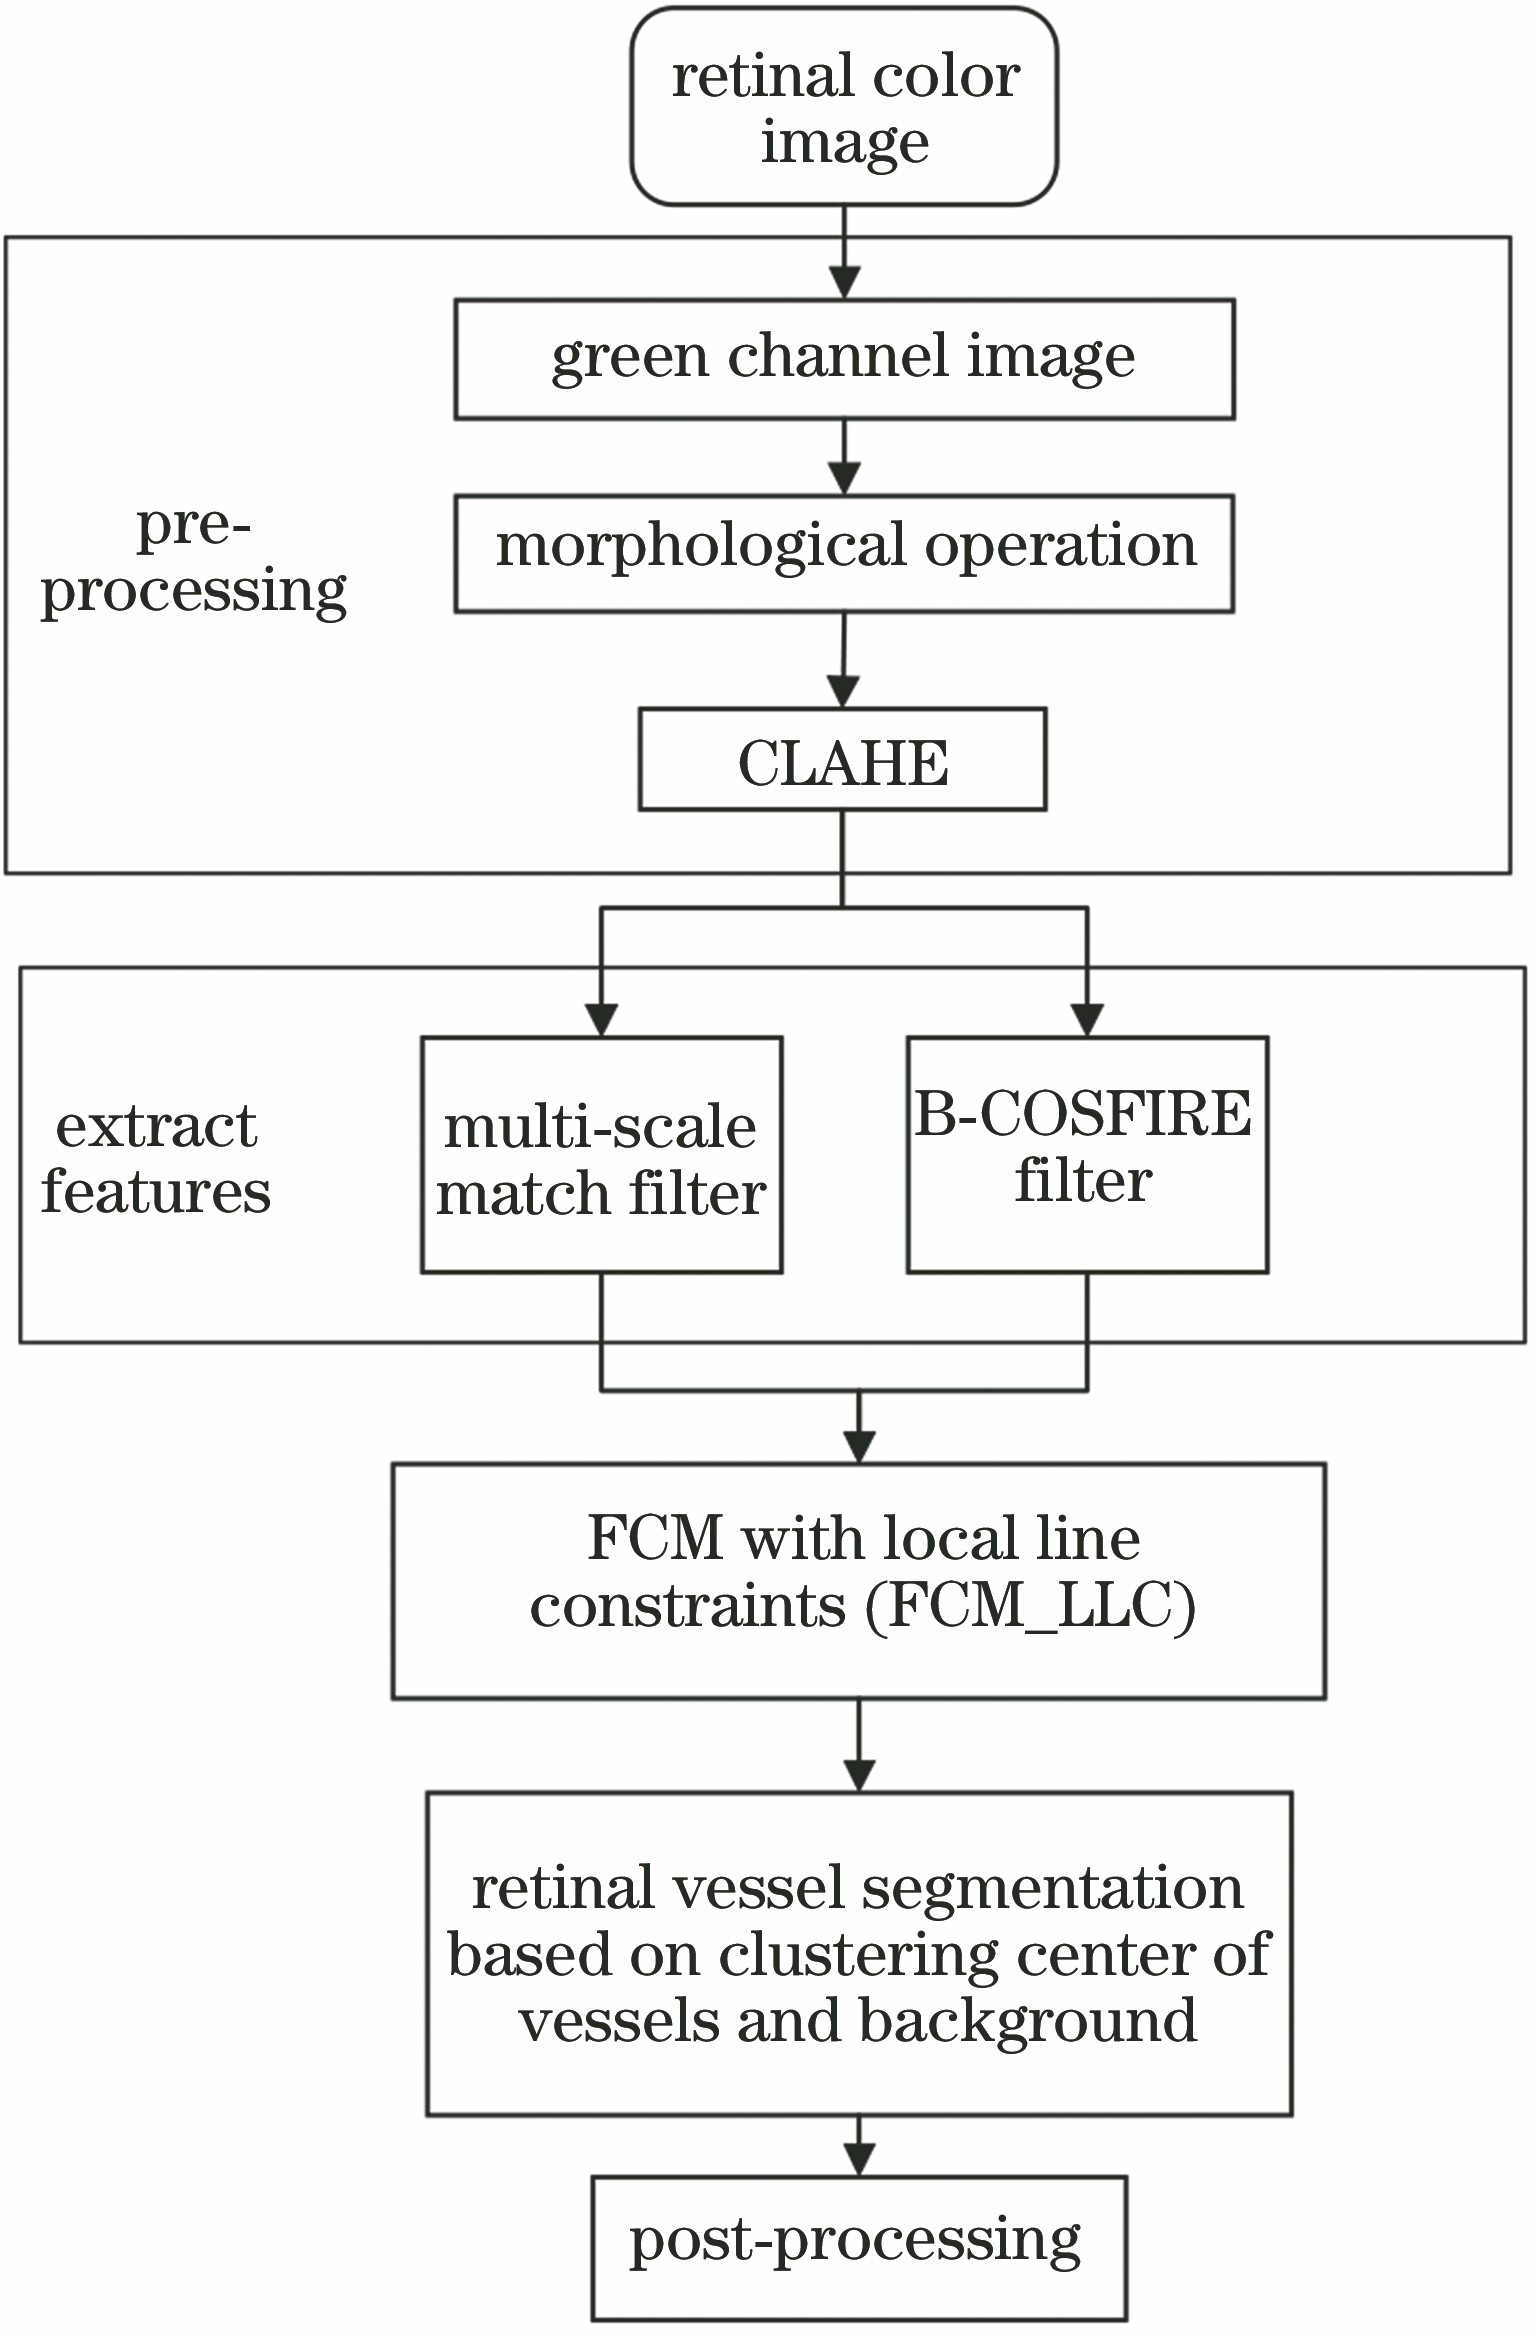
Fig. 1. Flowchart of the proposed method
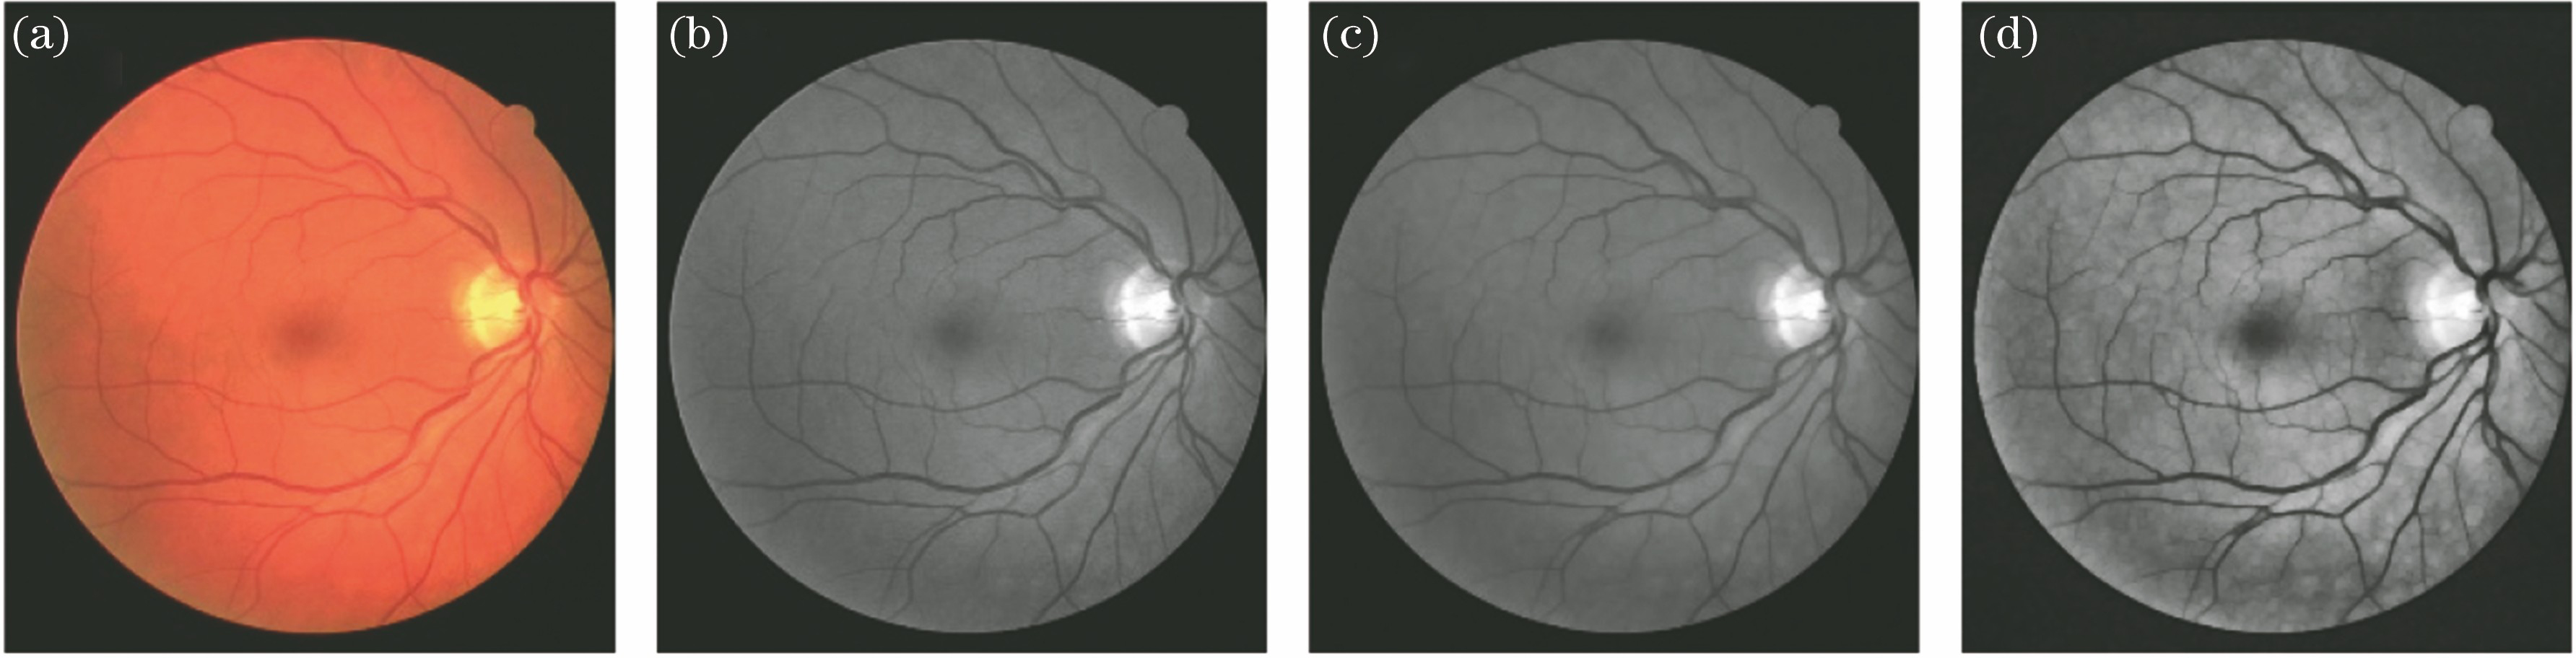
Fig. 2. Images of the pre-processing results. (a) Color fundus image; (b) green channel; (c) morphological open operation of Fig. 2 (b); (d) image enhancement of Fig. 2 (c) by CLAHE
Fig. 3. Multi-scale match filter response images. (a) Response image with σ=1; (b) response image with σ=2; (c) response image with all scales
Fig. 4. Schematic diagram of B-COSFIRE. (a) Principle of B-COSFIRE; (b) symmetrical B-COSFIRE structure; (c) asymmetric B-COSFIRE structure
Fig. 5. Response image of B-COSFIRE filtering. (a) Color fundus image; (b) result of B-COSFIRE filtering
Fig. 6. Schematic diagram of line detector structure. (a) Line detector schematic diagram; (b) schematic diagram of line detector matched with vessel; (c) local neighborhood information
Fig. 7. Segmentation result images of the DRIVE database. (a) The best result of images; (b) the worst result of images; (c) segmentation result of 15th images; (d) segmentation result of 18th images
Fig. 8. Segmentation results of lesion image. (a) Segmentation result of K-means; (b) segmentation result of FCM; (c) segmentation result of proposed method
Fig. 9. Results of proposed method and FCM. (a) Results of FCM; (b) results of the proposed method; (c) segmentation images manually marked by expert
|
Table 1. Segmentation performance comparison of proposed method and FCM%
|
Table 2. Performance of different retinal blood vessel segmentation methods%

Set citation alerts for the article
Please enter your email address
© Copyright 2018-2021 | Chinese Laser Press. All Rights Reserved 沪ICP备15018463号-20