• Chinese Optics Letters
  • Vol. 20, Issue 10, 100004 (2022)
Yuhang Chen1, Xiaosong Zhu1、*, Pengfei Lan1、**, and Peixiang Lu1、2
Author Affiliations
  • 1Wuhan National Laboratory for Optoelectronics and School of Physics, Huazhong University of Science and Technology, Wuhan 430074, China
  • 2Optics Valley Laboratory, Wuhan 430074, China
  • show less
    DOI: 10.3788/COL202220.100004 Cite this Article Set citation alerts
    Yuhang Chen, Xiaosong Zhu, Pengfei Lan, Peixiang Lu. Background-free detection of molecular chirality using a single-color beam [Invited][J]. Chinese Optics Letters, 2022, 20(10): 100004 Copy Citation Text show less
    (a) Top panel: schematic of the experimental setup. Capital X, Y, Z denote the macroscopic coordinate, and lowercase x, y, z denote the microscopic coordinate. Lower panel: the intensity distribution of the laser beam near the focus calculated in COMSOL, where yellow represents higher intensity. (b) The red thick circles with arrows show the Lissajou figures and rotation directions of the laser fields at different macroscopic points along the X direction near the focus. Blue dashed line represents the center of the beam. Meanwhile, the phases of the x and z components of the laser at different macroscopic points along the X direction are shown as the purple and orange lines, respectively, corresponding to the top axis. (c) Macroscopic schematic of the symmetry R^2Z·R^2x of the system. Any oriented molecule at an arbitrary macroscopic point (X, 0, Z) can find another molecule having the same configuration as that of the former molecule rotated by π around the x axis at (−X, 0, Z). The electric fields at these two points have the same ellipticity and opposite helicity, as shown by the red dotted circles. (d) Macroscopic schematic of the C^2y symmetry of the system. Any oriented molecule can find another molecule having the same configuration as that of the former molecule rotated by π around the y axis.
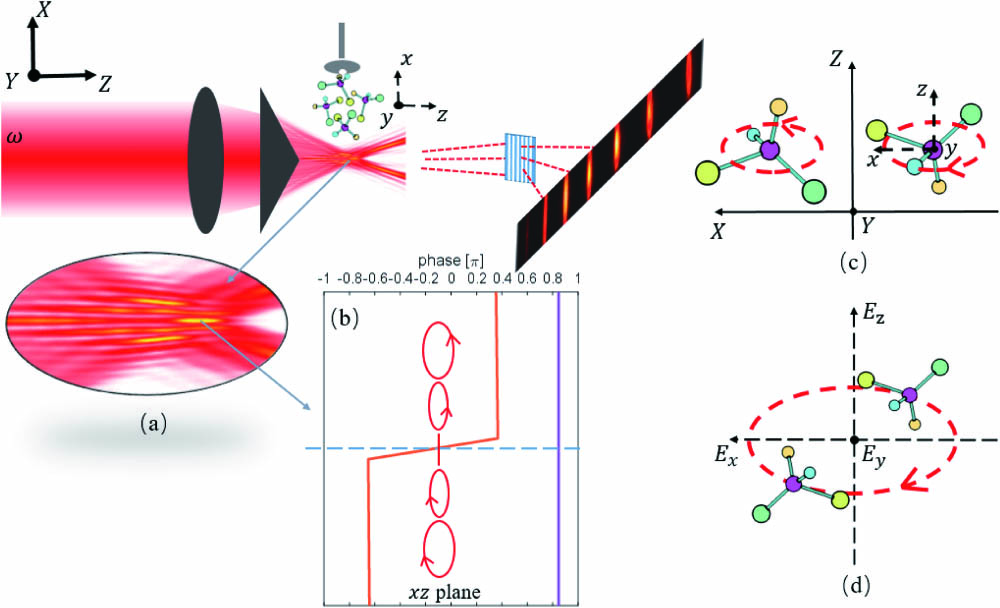
    Fig. 1. (a) Top panel: schematic of the experimental setup. Capital X, Y, Z denote the macroscopic coordinate, and lowercase x, y, z denote the microscopic coordinate. Lower panel: the intensity distribution of the laser beam near the focus calculated in COMSOL, where yellow represents higher intensity. (b) The red thick circles with arrows show the Lissajou figures and rotation directions of the laser fields at different macroscopic points along the X direction near the focus. Blue dashed line represents the center of the beam. Meanwhile, the phases of the x and z components of the laser at different macroscopic points along the X direction are shown as the purple and orange lines, respectively, corresponding to the top axis. (c) Macroscopic schematic of the symmetry R^2Z·R^2x of the system. Any oriented molecule at an arbitrary macroscopic point (X, 0, Z) can find another molecule having the same configuration as that of the former molecule rotated by π around the x axis at (−X, 0, Z). The electric fields at these two points have the same ellipticity and opposite helicity, as shown by the red dotted circles. (d) Macroscopic schematic of the C^2y symmetry of the system. Any oriented molecule can find another molecule having the same configuration as that of the former molecule rotated by π around the y axis.
    Numerically calculated normalized intensity of (a) x-polarized and (b) y-polarized HHG emissions from the chiral and racemic ensembles based on TDDFT. For the chiral ensemble, only odd harmonics have x-polarized components, and only even harmonics have y-polarized components. But, for the racemic ensemble, there is no y-polarized harmonic emission, and the x-polarized harmonic orders are still odd. The detailed parameters are given in the Letter.
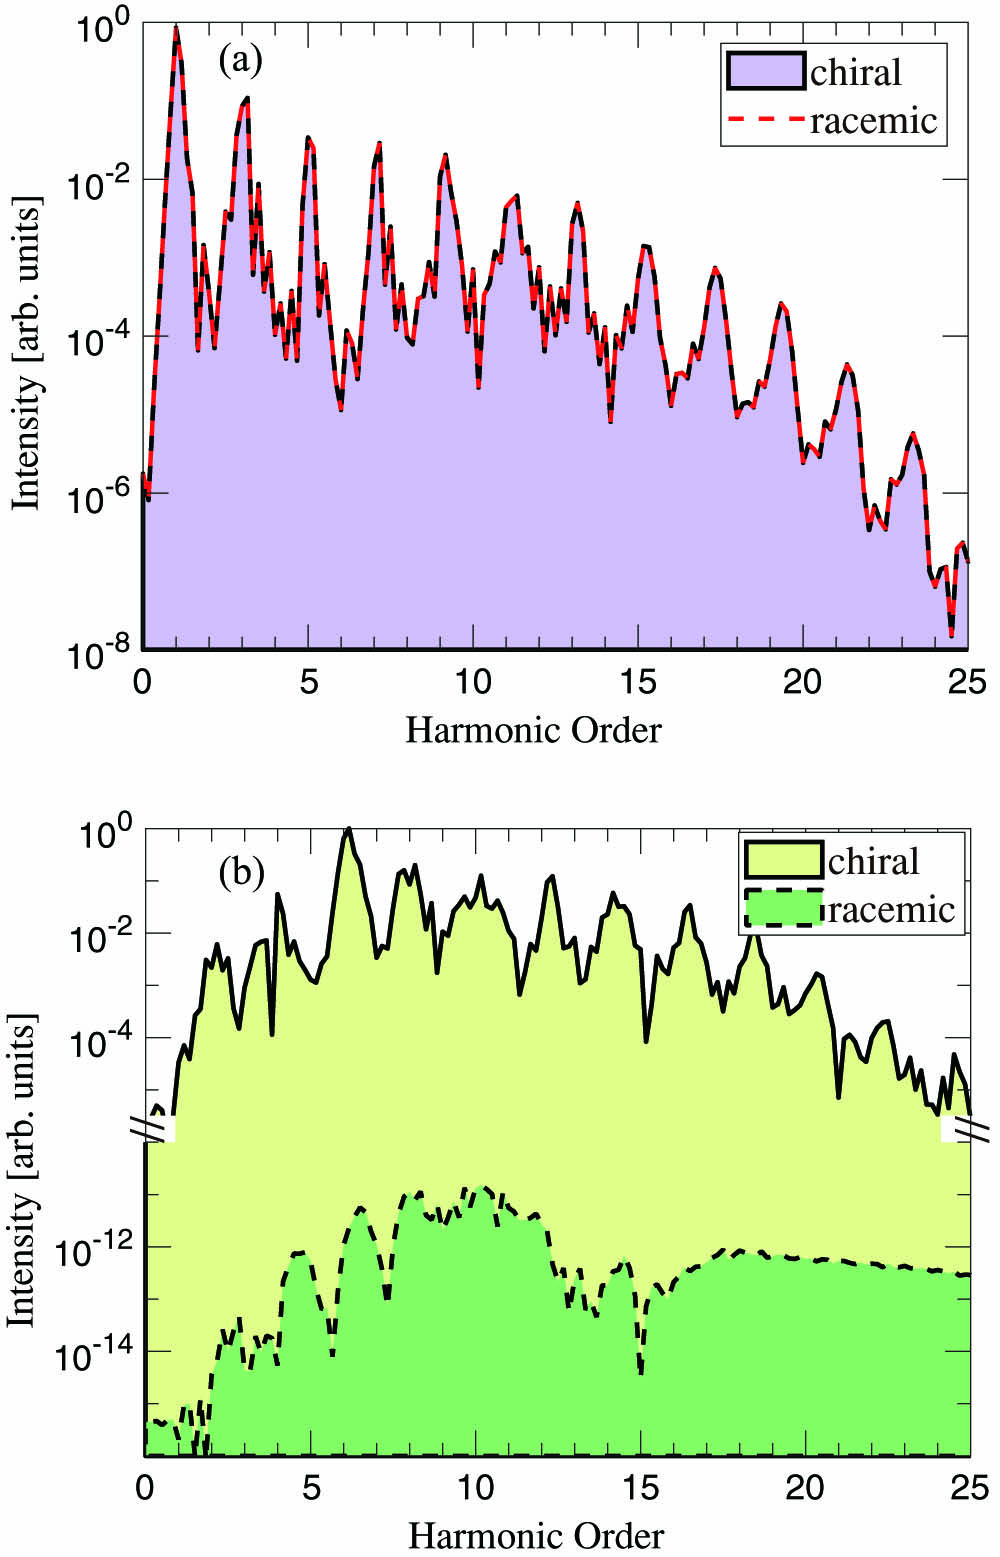
    Fig. 2. Numerically calculated normalized intensity of (a) x-polarized and (b) y-polarized HHG emissions from the chiral and racemic ensembles based on TDDFT. For the chiral ensemble, only odd harmonics have x-polarized components, and only even harmonics have y-polarized components. But, for the racemic ensemble, there is no y-polarized harmonic emission, and the x-polarized harmonic orders are still odd. The detailed parameters are given in the Letter.
    Numerically calculated phase of (a) y- and (b) x-polarized harmonics at (±X0,0,0).
    Fig. 3. Numerically calculated phase of (a) y- and (b) x-polarized harmonics at (±X0,0,0).
    Superposition of HHG spectra from (a) chiral ensemble and (b) racemic ensemble at (−X0, 0, 0) and (X0, 0, 0) in the far field. The maximum values are normalized to one for each harmonic.
    Fig. 4. Superposition of HHG spectra from (a) chiral ensemble and (b) racemic ensemble at (−X0, 0, 0) and (X0, 0, 0) in the far field. The maximum values are normalized to one for each harmonic.
    Yuhang Chen, Xiaosong Zhu, Pengfei Lan, Peixiang Lu. Background-free detection of molecular chirality using a single-color beam [Invited][J]. Chinese Optics Letters, 2022, 20(10): 100004
    Download Citation