Author Affiliations
1School of Physics and Physical Engineering, Shandong Provincial Key Laboratory of Laser Polarization and Information Technology, Qufu Normal University, Qufu 273165, China2School of Physics and Key Laboratory of Weak-Light Nonlinear Photonics, Nankai University, Tianjin 300071, China3National Laboratory of Solid State Microstructures, School of Physics and Collaborative Innovation Center of Advanced Microstructures, Nanjing University, Nanjing 210093, Chinashow less
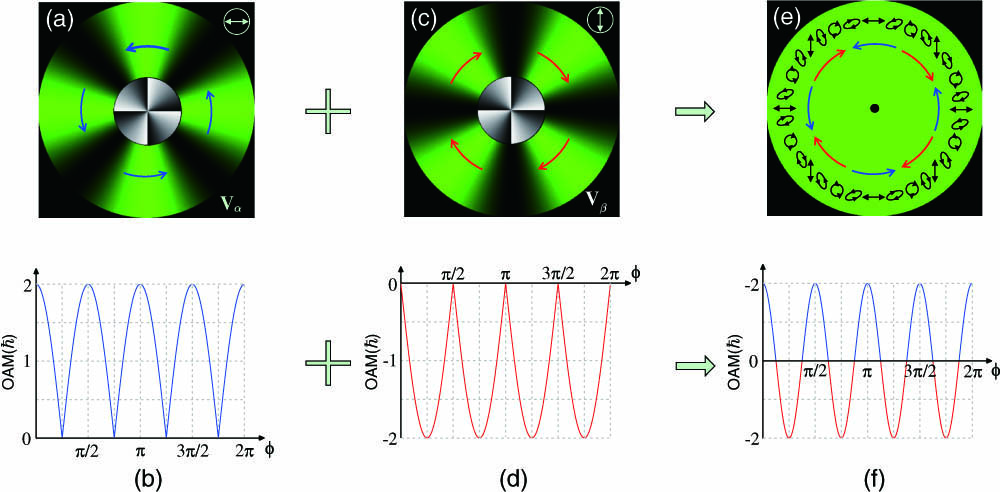
Fig. 1. Scheme of the ANU-OAM with and . (a), (c), and (e) The intensity, phase, polarization, and energy flow direction for the order, order, and the superposed VOF, respectively. (b) and (d) Dependence of the intensity modulated OAM per photon on the azimuthal coordinate for the orders. (f) Dependence of the average OAM per photon on the azimuthal coordinate for the superposed VOF. The blue and red arrows represent the directions of the energy flow, and the white arrows represent the polarization directions. The green and gray-scale patterns represent the intensity and phase distributions of the optical fields, respectively.
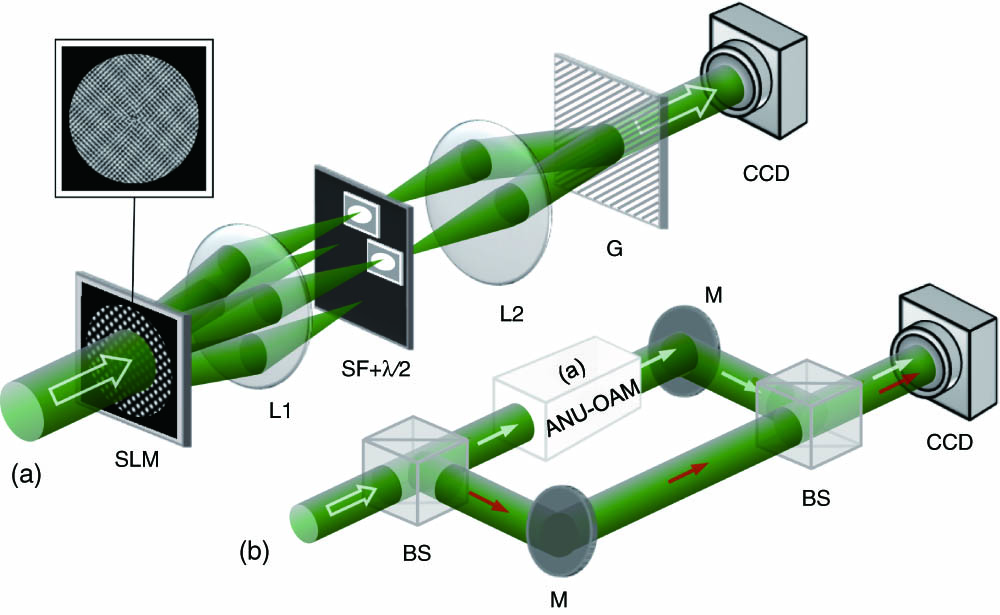
Fig. 2. Schematic of the experimental setup for generating and measuring the desired VOFs carrying ANU-OAM. (a) The generating setup. SLM, spatial light modulator; L1 () and L2 (), a pair of lenses; , quarter-wave plate; SF, spatial filter; G, Ronchi phase grating; CCD, charge-coupled device; inset, two-dimensional holographic grating. (b) The interference setup. BS, beam splitter; M, mirror. The white cuboid in (b) represents the setup in (a).
Fig. 3. VOFs carrying ANU-OAM with and . (a) The total intensity pattern and the simulated SoP distribution with linear (white), left-handed (red), and right-handed (yellow) polarizations, respectively. (b) The interference pattern between the order and the horizontally polarized reference beam. (c) The interference pattern between the order and the vertically polarized reference beam. The measured Stokes parameters of (d) , (e) , and (f) are shown in the second row. The corresponding simulated Stokes parameters are shown in the insets, respectively.
Fig. 4. Numerically simulated OAM spectra of two vortex optical fields with non-uniform amplitude profiles expressed as (a) and (b) , respectively. The spectral intensities are normalized by the maximum intensity of the initial mode.
Fig. 5. Intensity of the perfect VOFs carrying ANU-OAM with and . All of the pictures have the same size of .
Fig. 6. Dependence of the radius of the experimentally generated perfect VOFs carrying ANU-OAM with , , and on the propagation distance within a propagation range of .