• Chinese Optics Letters
  • Vol. 13, Issue 12, 122701 (2015)
Shuhong Hao1、2, Xiaowei Deng1、2, Qiang Zhang1、2, and Xiaolong Su1、2、*
Author Affiliations
  • 1State Key Laboratory of Quantum Optics and Quantum Optics Devices, Institute of Opto-Electronics, Shanxi University, Taiyuan 030006, China
  • 2Collaborative Innovation Center of Extreme Optics, Shanxi University, Taiyuan 030006, China
  • show less
    DOI: 10.3788/COL201513.122701 Cite this Article Set citation alerts
    Shuhong Hao, Xiaowei Deng, Qiang Zhang, Xiaolong Su. Distribution of a modulated squeezed state over a lossy channel[J]. Chinese Optics Letters, 2015, 13(12): 122701 Copy Citation Text show less
    (a) Physical model and (b) schematic of experimental setup for distributing a modulated squeezed state over a lossy channel. η: channel efficiency, EOM: electro-optic modulator, 99%R: a beam splitter with 99% reflection, FG: function generator, HWP: half-wave plate, PBS: polarization beam splitter, LO: local oscillator, LPF: a low-pass filter with a bandwidth of 10 kHz.
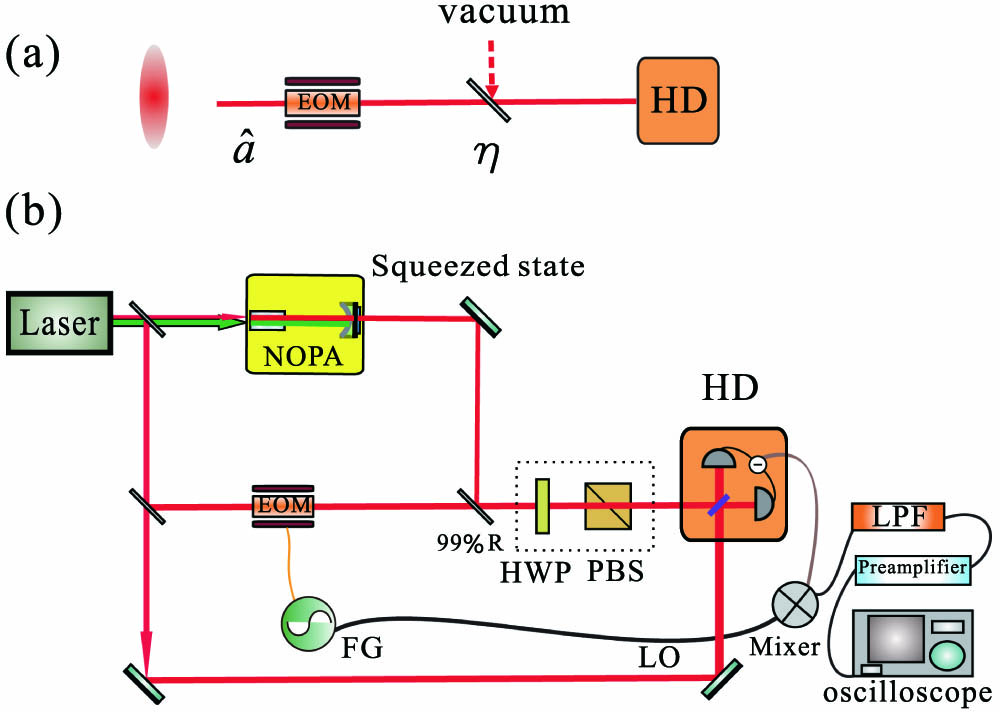
    Fig. 1. (a) Physical model and (b) schematic of experimental setup for distributing a modulated squeezed state over a lossy channel. η: channel efficiency, EOM: electro-optic modulator, 99%R: a beam splitter with 99% reflection, FG: function generator, HWP: half-wave plate, PBS: polarization beam splitter, LO: local oscillator, LPF: a low-pass filter with a bandwidth of 10 kHz.
    Measured Wigner function of the output state at different channel efficiencies. The solid circle and dotted ellipse are the standard errors of the vacuum state and the squeezed state, respectively. The straight line represents the displacement amplitude of the squeezed state.
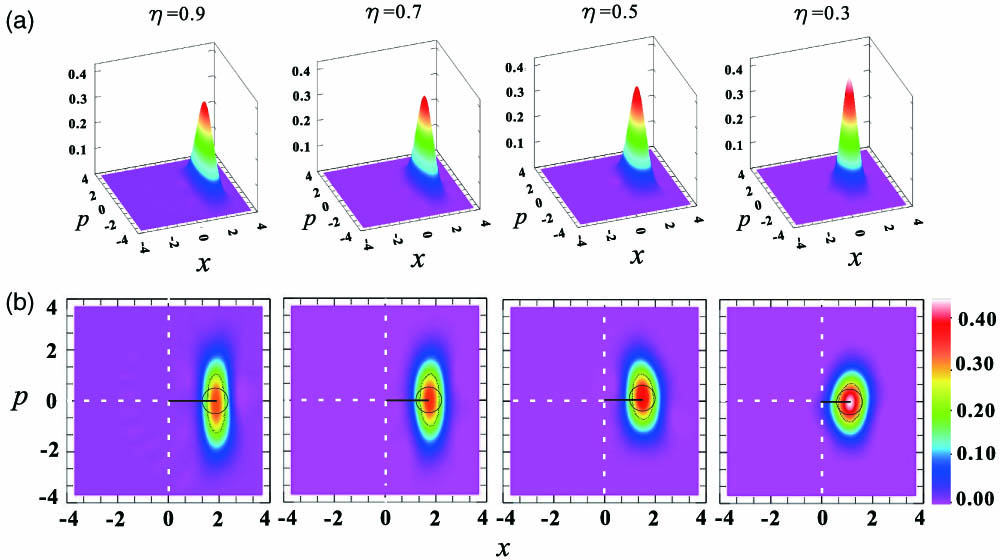
    Fig. 2. Measured Wigner function of the output state at different channel efficiencies. The solid circle and dotted ellipse are the standard errors of the vacuum state and the squeezed state, respectively. The straight line represents the displacement amplitude of the squeezed state.
    Noise powers of the output state measured directly at 2 MHz with different channel efficiencies. Traces SNL (black), i (blue), and ii (red) are the noise powers of SNL and the amplitude and phase quadratures of the output state, respectively. The resolution bandwidth and video bandwidth of the spectrum analyzer are 30 kHz and 300 Hz, respectively.
    Fig. 3. Noise powers of the output state measured directly at 2 MHz with different channel efficiencies. Traces SNL (black), i (blue), and ii (red) are the noise powers of SNL and the amplitude and phase quadratures of the output state, respectively. The resolution bandwidth and video bandwidth of the spectrum analyzer are 30 kHz and 300 Hz, respectively.
    Demodulated noise spectrum of the output state from 9 to 200 kHz. The resolution bandwidth and video bandwidth of the spectrum analyzer are 30 kHz and 300 Hz, respectively.
    Fig. 4. Demodulated noise spectrum of the output state from 9 to 200 kHz. The resolution bandwidth and video bandwidth of the spectrum analyzer are 30 kHz and 300 Hz, respectively.
    Demodulated noise power of the output state at 10 kHz with different channel efficiencies. Traces SNL (black), i (blue), and ii (red) are the noise powers of SNL and the amplitude and phase quadratures of the output state, respectively. The resolution bandwidth and video bandwidth of the spectrum analyzer are 30 kHz and 300 Hz, respectively.
    Fig. 5. Demodulated noise power of the output state at 10 kHz with different channel efficiencies. Traces SNL (black), i (blue), and ii (red) are the noise powers of SNL and the amplitude and phase quadratures of the output state, respectively. The resolution bandwidth and video bandwidth of the spectrum analyzer are 30 kHz and 300 Hz, respectively.
    Displacement and noise power of the output state. Traces i (blue) and ii (red) in (b) are the noise powers of the squeezing and anti-squeezing measured at 10 kHz, respectively.
    Fig. 6. Displacement and noise power of the output state. Traces i (blue) and ii (red) in (b) are the noise powers of the squeezing and anti-squeezing measured at 10 kHz, respectively.
    Shuhong Hao, Xiaowei Deng, Qiang Zhang, Xiaolong Su. Distribution of a modulated squeezed state over a lossy channel[J]. Chinese Optics Letters, 2015, 13(12): 122701
    Download Citation