Shuhong Hao, Xiaowei Deng, Qiang Zhang, Xiaolong Su. Distribution of a modulated squeezed state over a lossy channel[J]. Chinese Optics Letters, 2015, 13(12): 122701
Copy Citation Text
The distribution of a modulated squeezed state over a quantum channel is the basis for quantum key distribution (QKD) with a squeezed state. In this Letter, a modulated squeezed state is distributed over a lossy channel. The Wigner function of the distributed state is measured to observe the evolution of the quantum state over a lossy channel, which shows that the squeezing level and the displacement amplitude of the quantum state are decreased along with the increase of the channel loss. We also measure the squeezing level in the frequency domain by the frequency shift technique. The squeezing of the modulated squeezed state at the modulation frequency is observed in this way. The presented results supply a reference for a QKD with a squeezed state.
Quantum key distribution (QKD) allows two legitimate parties, Alice and Bob, who are linked by a quantum channel and an authenticated classical channel, to establish a secret key only known to themselves. Continuous variable (CV) QKD using a Gaussian quantum resource state, such as the entangled state, squeezed state, or coherent state, as the resource state, along with reconciliation and a privacy amplification procedure, can distill the secret key[1]. Recently, quantum discord has also been applied to complete QKD[2,3]. CV QKDs exploiting the coherent state[4–10] and the entangled state[11–13] have been experimentally realized in recent years.
In the proposed QKD scheme with the squeezed state[14–18], squeezed states that are randomly displaced along the squeezed quadrature, which is obtained by modulating the squeezed states, are transmitted from Alice to Bob. Bob performs homodyne or heterodyne detection on the received quantum state. Then, Alice and Bob use the classical data process, such as post-selection, reconciliation (reverse reconciliation), and privacy amplification, to distill the secret key[1]. Loss and excess noise in the quantum channel are two parameters that limit the secret key rate and transmission distance of the CV QKD scheme. It has been shown that QKD based on the squeezed state and heterodyne detection can tolerate more excess noise than a QKD scheme with the coherent state[17]. Recently, a squeezed state was distributed through an atmospheric channel, which supplies a reference for free-space CV QKD with the squeezed state[19].
The distribution of modulated squeezed states over a quantum channel is the precondition for a QKD with the squeezed state. What we are concerned with is the squeezing property of the modulated squeezed state after it is transmitted through a lossy channel. In this Letter, we distribute a modulated squeezed state over a lossy channel. The Wigner function and noise spectrum of the output state are measured. From the measured Wigner function of the output state at different loss levels, we show that the squeezing level and the amplitude of the squeezed state are decreased with the increase of the loss (decrease of the channel efficiency). The noise of the squeezed quadrature is higher than the shot-noise level (SNL) since the variance of the modulated signal is added to the noise of the squeezed quadrature. We also quantify the squeezing of the output state by the frequency shift technique, where the noise of the output state is demodulated by the reference signal. In this way, squeezing at a high frequency (2 MHz in our experiment) is measured by the frequency shift technique, while the modulation signal is filtered. The squeezing of the modulated squeezed state is observed from 9 to 200 kHz. From the decrease of the squeezing at 10 kHz, the impact of the loss in the channel is quantified.
Sign up for Chinese Optics Letters TOC. Get the latest issue of Chinese Optics Letters delivered right to you!Sign up now
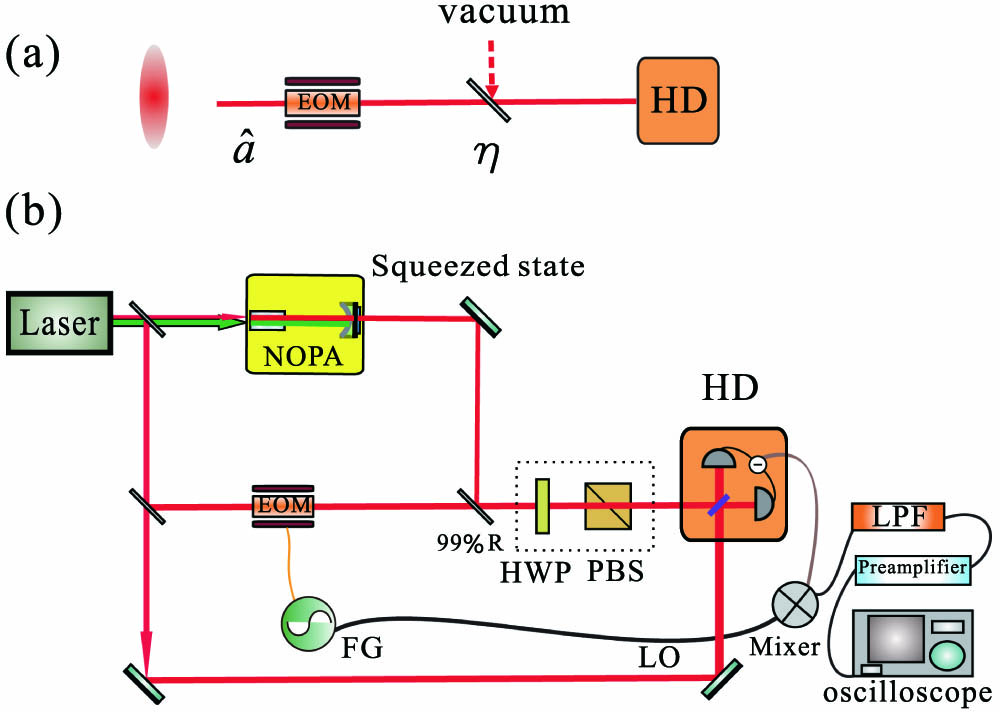
Figure 1(a) shows the physical model of distributing a modulated squeezed state over a lossy channel. The lossy channel is modeled by an optical beam splitter with transmission efficiency . A squeezed state is modulated by a modulation signal and transmitted through a lossy channel. The output mode is detected by a homodyne detector (HD). The amplitude and phase quadratures of an optical mode are defined as and , respectively. For a vacuum state, the variance of the amplitude and phase quadratures are , which correspond to the SNL. The output mode is given by where represents the vacuum noise coming from the channel. The Wigner function of the output state is where and represent the vector and the mean value (displacement) of the amplitude and phase quadratures, respectively, and is the determinant of covariance matrix . In our case, considering the channel efficiency , the covariance matrix can be written as where and are the squeezing and anti-squeezing parameter of the initial amplitude-squeezed state. When , the squeezed state, is a pure state, it is a minimum uncertainty state, while when , the squeezed state is not pure. The displacement of the output state is where and , in which and represent the displacement of the input state along two axes in phase space.
Figure 1.(a) Physical model and (b) schematic of experimental setup for distributing a modulated squeezed state over a lossy channel. : channel efficiency, EOM: electro-optic modulator, 99%R: a beam splitter with 99% reflection, FG: function generator, HWP: half-wave plate, PBS: polarization beam splitter, LO: local oscillator, LPF: a low-pass filter with a bandwidth of 10 kHz.
Figure 1(b) shows the schematic of the experimental setup. A non-degenerate optical parametric amplifier (NOPA) is used to produce the squeezed state. The NOPA is pumped by a continuous-wave intracavity frequency-doubled and frequency-stabilized Nd:YAP/LBO, which outputs both the fundamental and the second-harmonic waves (Yu-guang Co, Ltd., F-VIB)[20]. The output fundamental wave at the 1080 nm wavelength is used for the injected signals of the NOPA and the local oscillator of the HD. The second-harmonic wave at the 540 nm wavelength serves as the pump field of the NOPA. The NOPA consists of an -cut type-II KTP crystal and a concave mirror[21,22]. The front face of the KTP is coated to be used for the input coupler and the concave mirror serves as the output coupler of the squeezed states, which is mounted on a piezo-electric transducer to actively lock the cavity length of NOPA on resonance with the injected signal at 1080 nm. The transmissions of the input coupler at 540 and 1080 nm are 99.8% and 0.04%, respectively. The transmissions of the output coupler at 540 and 1080 nm are 0.5% and 5.2%, respectively. The finesses of the NOPA for 540 and 1080 nm are 3 and 117, respectively. During the measurements, the pump power of the NOPA at the 540 nm wavelength is about 180 mW, which is below the oscillation threshold of 240 mW, and the intensity of the injected signal at 1080 nm is 6 mW. The NOPA is operating under the de-amplification condition, where the phase difference between the pump and injected beam is locked to ( is an integer). Under this condition, the coupled modes at the and −45° polarization directions are the quadrature-amplitude and the quadrature-phase squeezed states, respectively[23]. The experimentally measured squeezing is (), while the antisqueezing quadrature components is 8.9 dB () at 2 MHz.
We simulate one modulation level (one random Gaussian number) by applying a sine wave modulation signal at 2 MHz on the amplitude-squeezed state through an electro-optic modulator. The amplitude-squeezed state is modulated with a 12 dB modulation signal on the amplitude quadrature ( and ) and distributed over a lossy channel. The modulation is completed by mixing the squeezed state with a modulated auxiliary coherent state on a beam splitter with a 99% reflection coefficient. The loss in the quantum channel is mimicked by an adjustable beam splitter, which is made up by a half-wave plate and a polarization beam splitter. After the transmission, the output state is measured by the HD. The local oscillator of the HD is set to around 5 mW. The measured SNL is about 17.8 dB above the electronic noise level, which guarantees that the result of the homodyne detection is almost not affected by electronic noises. The noise spectrum of the output state is measured by sending the output photocurrent of the homodyne detection system to a spectrum analyzer. The Wigner function of the output state is measured by mixing the reference signal at the modulation frequency and the AC output of the HD. The output signal is low-pass filtered with a bandwidth of 10 kHz and amplified before it is recorded by a digital storage oscilloscope. The sampling rate is chosen to be 500 kpts/s. About 50000 data points are used to reconstruct the Wigner function of the output state. The maximum likelihood algorithm is used in the reconstruction of the Wigner function[24]. In the measurement of the Wigner function, the relative phase between the output optical beam and the local oscillator in the HD is scanned with a frequency of 2 Hz.
Figure 2 shows the measured Wigner function of the output state at different channel efficiencies. Figures 2(a) and 2(b) are the reconstructed Wigner function and the projection of it in phase space, respectively. It is obvious that the amplitude modulation in the input amplitude-squeezed state is a displacement from the amplitude quadrature of the squeezed state in phase space. The solid circle represents the uncertainty of the vacuum state in the phase space, which is the standard error of the vacuum noise. In this Letter, according to the definition of quadratures of the optical mode, the noise variance of a vacuum state is 1/4 for both the amplitude and phase quadratures. Then, we have the standard error of for the vacuum state, which is the radius of the solid circle. The contour of the Wigner function (dotted line in Fig. 2) gives the standard error of a quantum state. The shot axis of the ellipse is smaller than the radius of the circle, which means that the output state is a squeezed state. What is more, we can calculate the variance of the modulated state through the measured Wigner function picture of Fig. 2 by comparing the short axis with the radius of the vacuum state. We can obtain the variance of the squeezed quadrature by . The variance of the anti-squeezed quadrature can be obtained with the long axis of the ellipse . The measured displacement of the output state and the variance of the squeezed quadrature are and {, , , } at , respectively. It is obvious that the squeezing and displacement levels of the output state are decreased along with the decrease of the channel efficiency.
Figure 2.Measured Wigner function of the output state at different channel efficiencies. The solid circle and dotted ellipse are the standard errors of the vacuum state and the squeezed state, respectively. The straight line represents the displacement amplitude of the squeezed state.
From Eq. (2), we have the maximum of the Wigner function, which is . For a pure squeezed state (), at . However, in the experiment, the generated squeezed state is not usually pure; generally, . In our experiment, the squeezing and anti-squeezing parameters of the generated squeezed state are and , respectively, which means that the maximum of the Wigner function is decreased to at . In the experiment, the measured maximums of the Wigner function are at , which shows that the maximum of the Wigner function of the output state is changed at different channel efficiencies.
The amplitude and phase quadratures of the modulated squeezed state after transmission are given by and , respectively. It is obvious that the noise of the squeezed state and modulation signal are measured simultaneously when we measure the noise power of the output mode with a spectrum analyzer. The measured noise power of the squeezed quadrature of the modulated squeezed state may be higher than the SNL because the modulation signal is added.
Figure 3 shows the measured noise power of the output state at different channel efficiencies, where the AC part of the HD system is recorded by a spectrum analyzer. It is obvious that noise of the amplitude quadrature (squeezed quadrature) is higher than the SNL, as we mentioned above. The measured noise power of the amplitude and phase quadratures of the state are {, , , } and {, , , } at , respectively.
Figure 3.Noise powers of the output state measured directly at 2 MHz with different channel efficiencies. Traces SNL (black), i (blue), and ii (red) are the noise powers of SNL and the amplitude and phase quadratures of the output state, respectively. The resolution bandwidth and video bandwidth of the spectrum analyzer are 30 kHz and 300 Hz, respectively.
Another way to quantify the squeezing level of the output state is to demodulate the output state with the reference signal before measuring the noise spectrum. The output signal from the mixer is low-pass filtered with a bandwidth of 10 kHz, amplified, and then recorded by a spectrum analyzer. In this way, the squeezing at the sideband of 2 MHz is measured by the frequency shift technique. Figure 4 shows the demodulated noise spectrum of the output state from 9 to 200 kHz. The squeezing level of the modulated squeezed state (red trace) is still about 3.5 dB below the corresponding SNL (black trace), which is same as what we obtained for the squeezed state without modulation at 2 MHz. We also measured the demodulated noise spectrum of the output state at 10 kHz over the lossy channel, which is shown in Fig. 5. The squeezing levels are , , , and at , 0.7, 0.5, and 0.3, respectively.
Figure 4.Demodulated noise spectrum of the output state from 9 to 200 kHz. The resolution bandwidth and video bandwidth of the spectrum analyzer are 30 kHz and 300 Hz, respectively.
Figure 5.Demodulated noise power of the output state at 10 kHz with different channel efficiencies. Traces SNL (black), i (blue), and ii (red) are the noise powers of SNL and the amplitude and phase quadratures of the output state, respectively. The resolution bandwidth and video bandwidth of the spectrum analyzer are 30 kHz and 300 Hz, respectively.
Figure 6 shows the displacement [Fig. 6(a)] and noise power [Fig. 6(b)] of the output state over a lossy channel. The experimentally measured data points are marked on the figure, and agree well with the theoretical curves. It is obvious that the displacement and squeezing level of the modulated squeezed state decrease along with the decrease of the transmission efficiency (increase of the loss) in the lossy channel.
Figure 6.Displacement and noise power of the output state. Traces i (blue) and ii (red) in (b) are the noise powers of the squeezing and anti-squeezing measured at 10 kHz, respectively.
In conclusion, a modulated squeezed state is distributed over a lossy channel. By measuring the Wigner function of the output state, we show that the squeezing level and displacement amplitude of the squeezed state are decreased along with the decrease of the channel efficiency. The maximum of the Wigner function of the output state is changed at different channel efficiencies because the squeezed state is not pure. The squeezing of the modulated squeezed state is measured by a frequency shift, which enables us to quantify the decrease of the squeezing along with the decrease of the channel efficiency. The presented results enable us to observe the evolution of the quantum state over a lossy channel in a QKD with the squeezed state.
Shuhong Hao, Xiaowei Deng, Qiang Zhang, Xiaolong Su. Distribution of a modulated squeezed state over a lossy channel[J]. Chinese Optics Letters, 2015, 13(12): 122701