- Spectroscopy and Spectral Analysis
- Vol. 42, Issue 10, 3283 (2022)
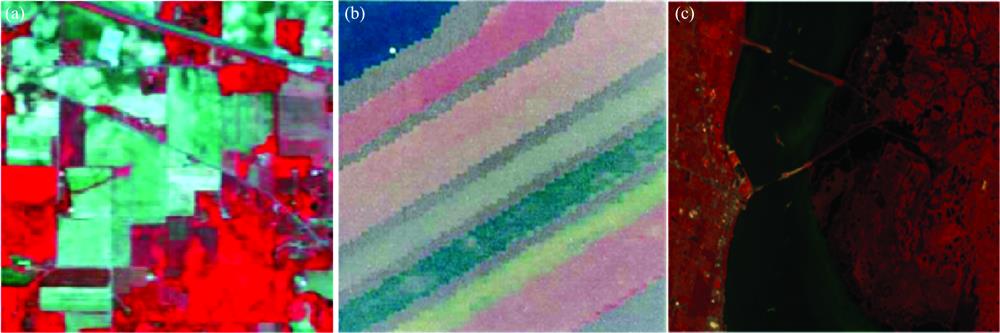
Fig. 1. Hyperspectral images of each standard dataset
(a): Indian pines; (b): Salinas-A; (c): KSC
(a): Indian pines; (b): Salinas-A; (c): KSC
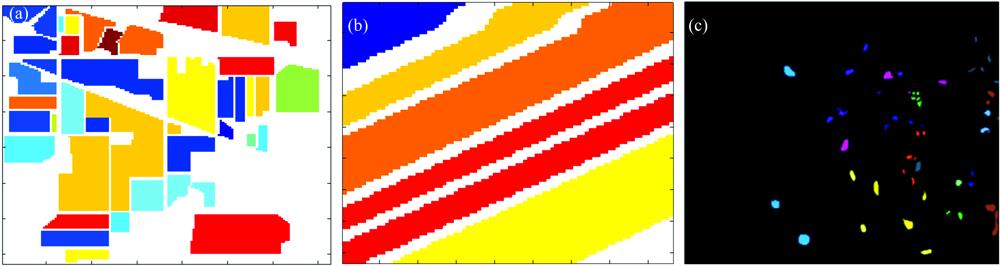
Fig. 2. References of real features for each standard dataset
(a): Indian pines; (b): Salinas-A; (c): KSC
(a): Indian pines; (b): Salinas-A; (c): KSC
Fig. 3. Classification results of three feature selection algorithms for hyperspectral images of Indian pines dataset
Fig. 4. Classification results of three feature selection algorithms for hyperspectral images of Salinas-A dataset
Fig. 5. Classification results of three feature selection algorithms for hyperspectral images of KSC dataset
Fig. 6. Comprehensive comparison of three feature selection algorithms
(a): Classification accuracy; (b): Feature dimension and runtime
(a): Classification accuracy; (b): Feature dimension and runtime
|
Table 1. Hyperspectral dataset description
|
Table 2. Classification results based on the best feature subset of the Indian pines dataset
|
Table 3. Classification results based on the best feature subset of the Salinas-A dataset
|
Table 4. Classification results with the best feature subset of the KSC dataset

Download Citation


Set citation alerts for the article
Please enter your email address

© Copyright 2018-2021 | Chinese Laser Press. All Rights Reserved 沪ICP备15018463号-20