• Acta Optica Sinica
  • Vol. 38, Issue 10, 1005001 (2018)
Taojie Li1、2、3、*, Yuefeng Wang1、*, Zheng Yang2、3, Jun Han4, Jianjun Chen2、3, Jing Li2、3, Shaoyun Yin2、3, and Peng Wu2、3、*
Author Affiliations
  • 1 Department of Electronic and Optical Engineering, Army Engineering University of PLA, Shijiazhuang, Hebei 0 50003, China
  • 2 System Integration Center of Optics and Electronics, Chongqing Institute of Green and Intelligent Technology, Chinese Academy of Sciences, Chongqing 400714, China
  • 3 Chongqing Key Laboratory of Multi-Scale Manufacturing Technology, Chongqing 400714, China
  • 4 Wuhan Raycus Fiber Laser Technologies Co. Ltd, Wuhan, Hubei 430070, China
  • show less
    DOI: 10.3788/AOS201838.1005001 Cite this Article Set citation alerts
    Taojie Li, Yuefeng Wang, Zheng Yang, Jun Han, Jianjun Chen, Jing Li, Shaoyun Yin, Peng Wu. Thickness Error Analysis of Diffractive Segmented Primary Lens and Resolution Enhancement Experiment[J]. Acta Optica Sinica, 2018, 38(10): 1005001 Copy Citation Text show less
    Structural diagram of segmented diffractive primary lens
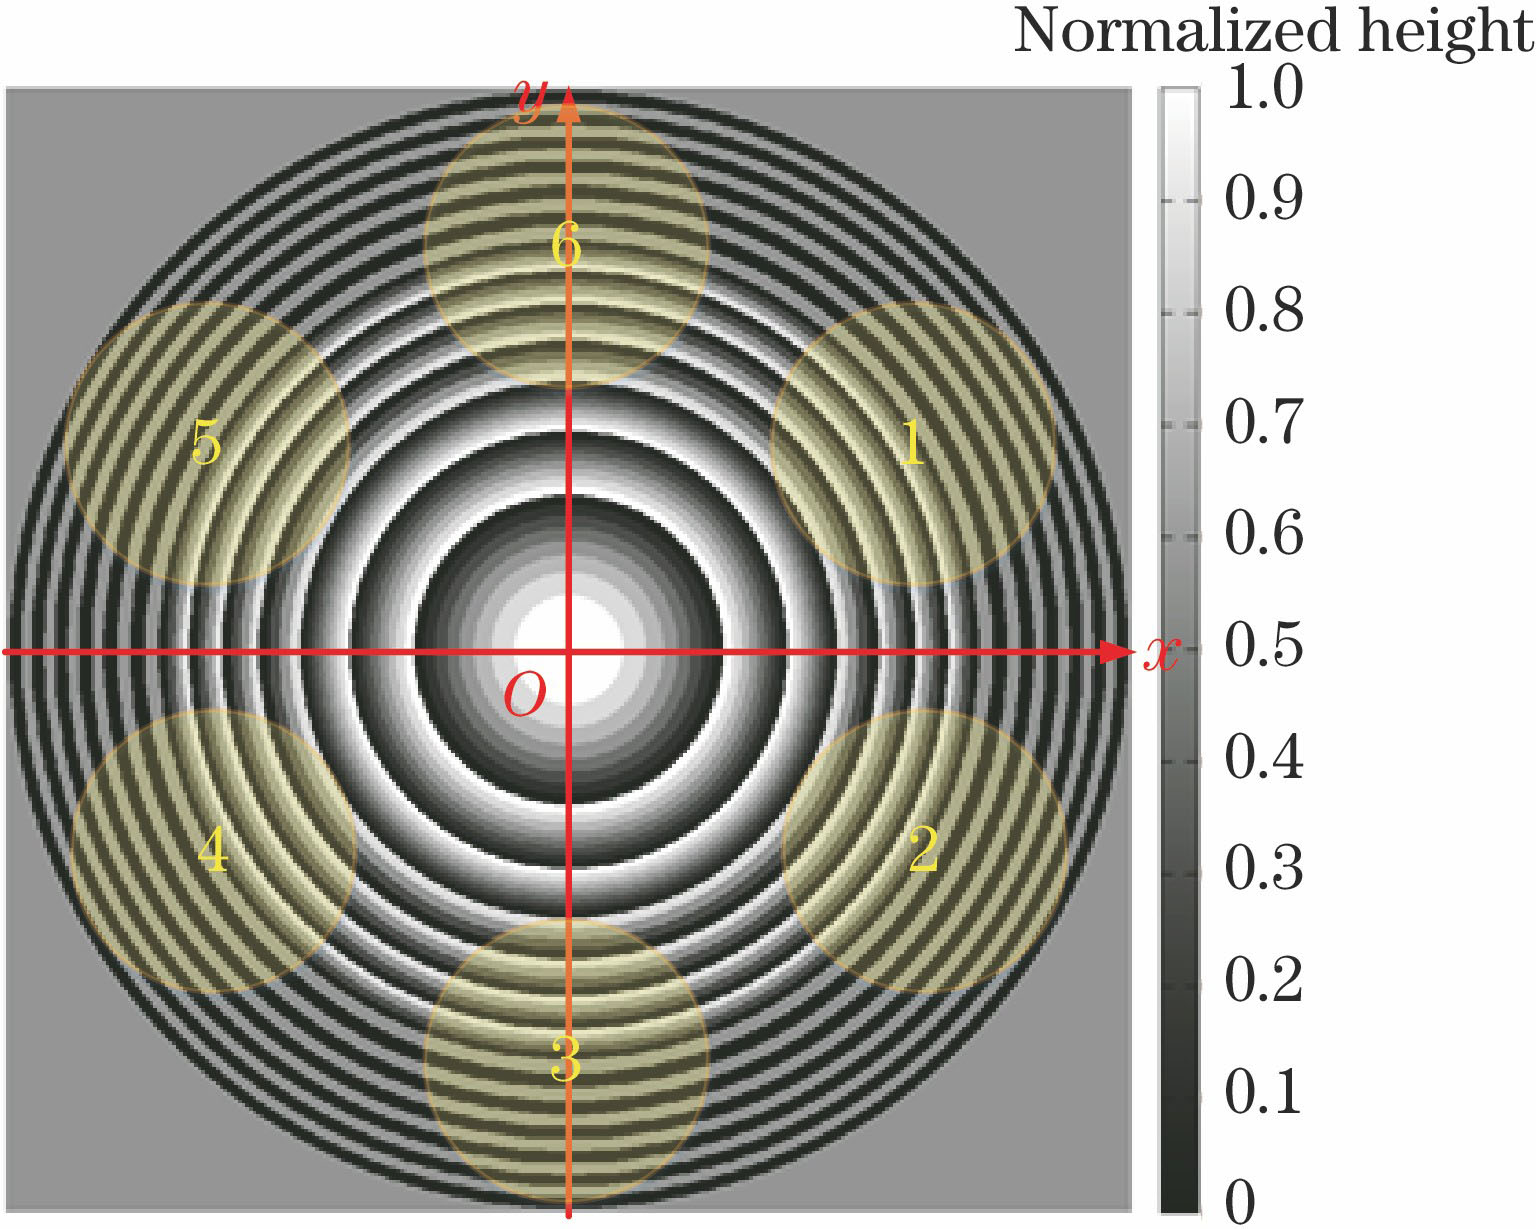
    Fig. 1. Structural diagram of segmented diffractive primary lens
    Schematic of spherical deformation of sub-aperture
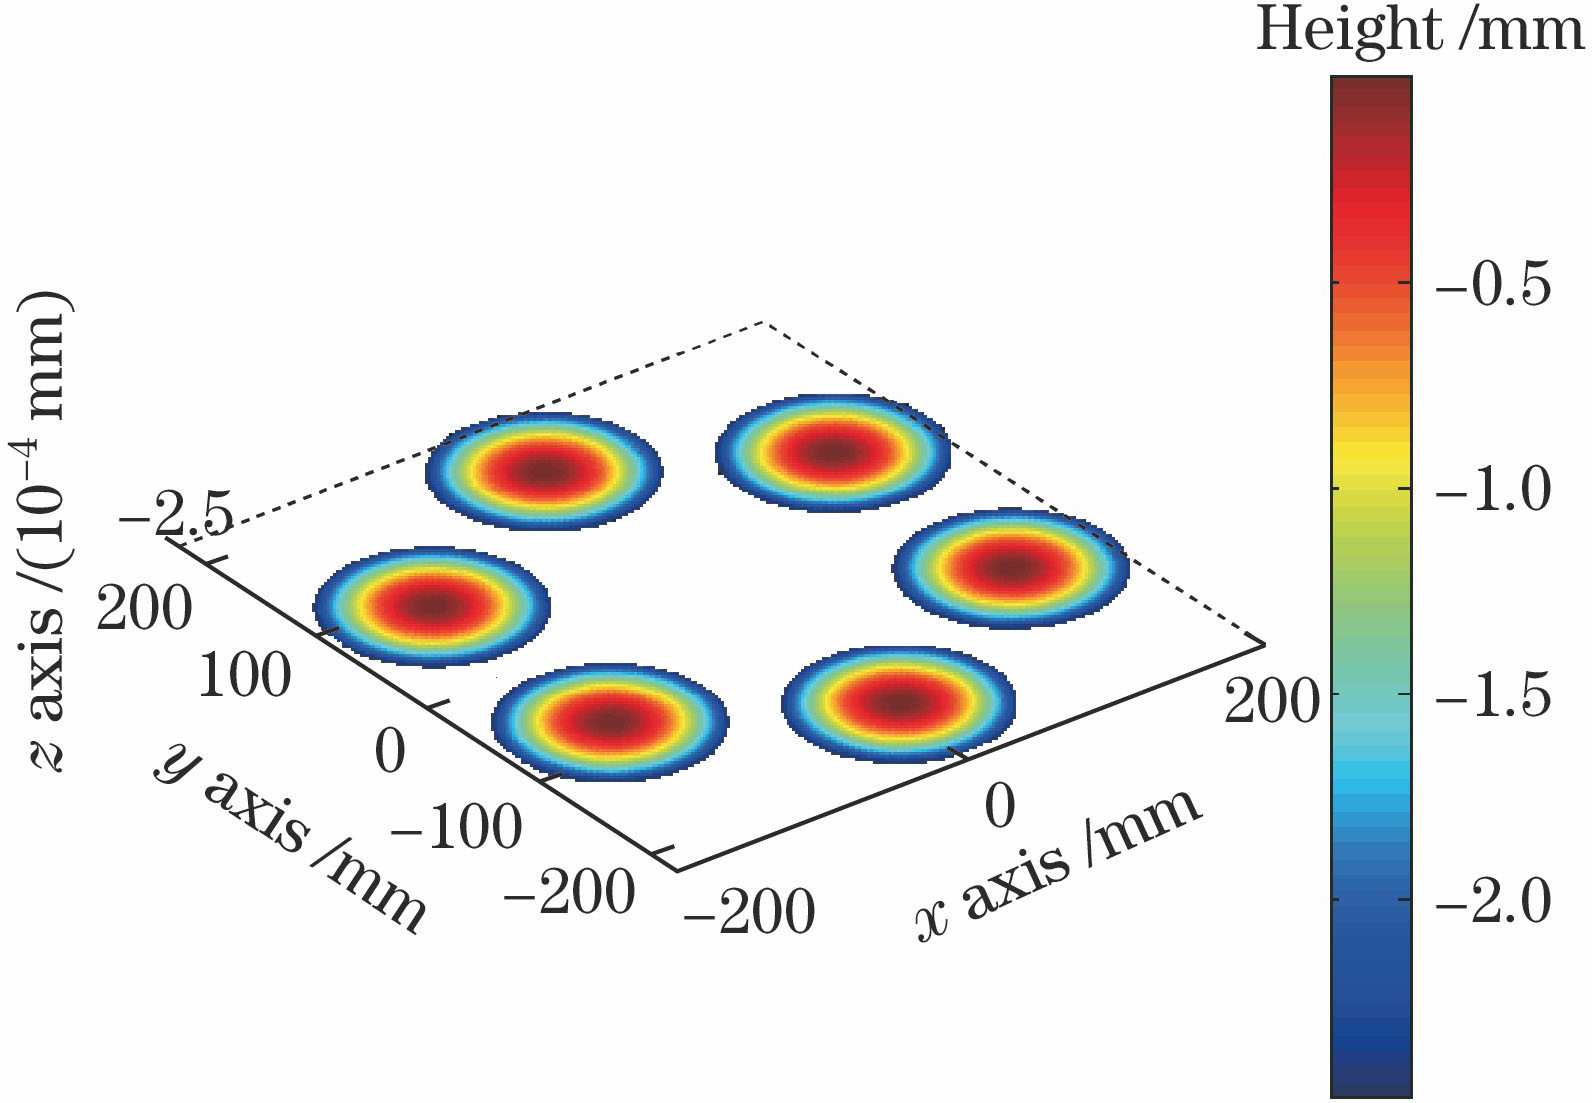
    Fig. 2. Schematic of spherical deformation of sub-aperture
    Schematic of deformation error of surface without diffraction structure
    Fig. 3. Schematic of deformation error of surface without diffraction structure
    PSF and corresponding ZEMAX results. (a) PSF of spherical surface and (b) its corresponding ZEMAX result; (c) cross section of PSF and (d) its corresponding ZEMAX result
    Fig. 4. PSF and corresponding ZEMAX results. (a) PSF of spherical surface and (b) its corresponding ZEMAX result; (c) cross section of PSF and (d) its corresponding ZEMAX result
    Schematic of thickness errors
    Fig. 5. Schematic of thickness errors
    Optical path
    Fig. 6. Optical path
    Experimental setup
    Fig. 7. Experimental setup
    Binary microstructure and its corresponding wavefront.(a) Microstructure; (b) wavefront
    Fig. 8. Binary microstructure and its corresponding wavefront.(a) Microstructure; (b) wavefront
    Wavefront aberration of segmented primary lens
    Fig. 9. Wavefront aberration of segmented primary lens
    Spots. (a)(b) Spot obtained by measurement of single sub-aperture; (c) spot obtained by coherent synthesis of two sub-apertures
    Fig. 10. Spots. (a)(b) Spot obtained by measurement of single sub-aperture; (c) spot obtained by coherent synthesis of two sub-apertures
    Simulation. (a) Simulation of single sub-aperture; (b) simulation of coherent synthesis of two sub-apertures
    Fig. 11. Simulation. (a) Simulation of single sub-aperture; (b) simulation of coherent synthesis of two sub-apertures
    Variance /nm39404550
    Probability /%99.9999.8999.2297.67
    Table 1. Statistical results of random normal distribution of variance
    Taojie Li, Yuefeng Wang, Zheng Yang, Jun Han, Jianjun Chen, Jing Li, Shaoyun Yin, Peng Wu. Thickness Error Analysis of Diffractive Segmented Primary Lens and Resolution Enhancement Experiment[J]. Acta Optica Sinica, 2018, 38(10): 1005001
    Download Citation