• NUCLEAR TECHNIQUES
  • Vol. 45, Issue 11, 110602 (2022)
Faliang XIAO1、2, Tingting ZHONG1、2, Weiling FU2、3, Xiaoyan KANG1、2, and Shuiquan DENG2、4、*
Author Affiliations
  • 1College of Chemistry, Fuzhou University, Fuzhou 350108, China
  • 2State Key Laboratory of Structural Chemistry, Fujian Institute of Research on the Structure of Matter, Chinese Academy of Sciences, Fuzhou 350002, China
  • 3College of Chemistry and Materials Science, Fujian Normal University, Fuzhou 350007, China
  • 4Fujian Science & Technology Innovation Laboratory for Optoelectronic Information of China, Fuzhou 350108, China
  • show less
    DOI: 10.11889/j.0253-3219.2022.hjs.45.110602 Cite this Article
    Faliang XIAO, Tingting ZHONG, Weiling FU, Xiaoyan KANG, Shuiquan DENG. Distribution of pH values in a model simulating the secondary side of a steam generator[J]. NUCLEAR TECHNIQUES, 2022, 45(11): 110602 Copy Citation Text show less
    Diagram of straight pipe model, the area enclosed by the thick solid line is the cross section of the model (the grey part denotes the water in the secondary circuit, the blue part denotes the tube support plate) (color online)
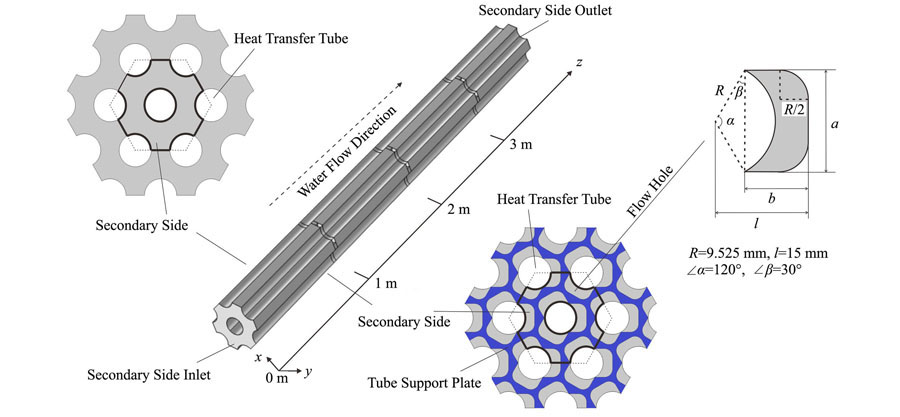
    Fig. 1. Diagram of straight pipe model, the area enclosed by the thick solid line is the cross section of the model (the grey part denotes the water in the secondary circuit, the blue part denotes the tube support plate) (color online)
    Calculated distribution of the fluid velocities in the secondary circuit model(a) Average velocity over cross sections at various heights, (b) Velocity distributions on three selected cross sections at z = 1.5 m, 2.0 m, 2.5 m, respectively, (c) Velocity distribution on the longitudinal section nearby a support plate at z = 2.0 m, see the dashed line of (b) for the location of the section
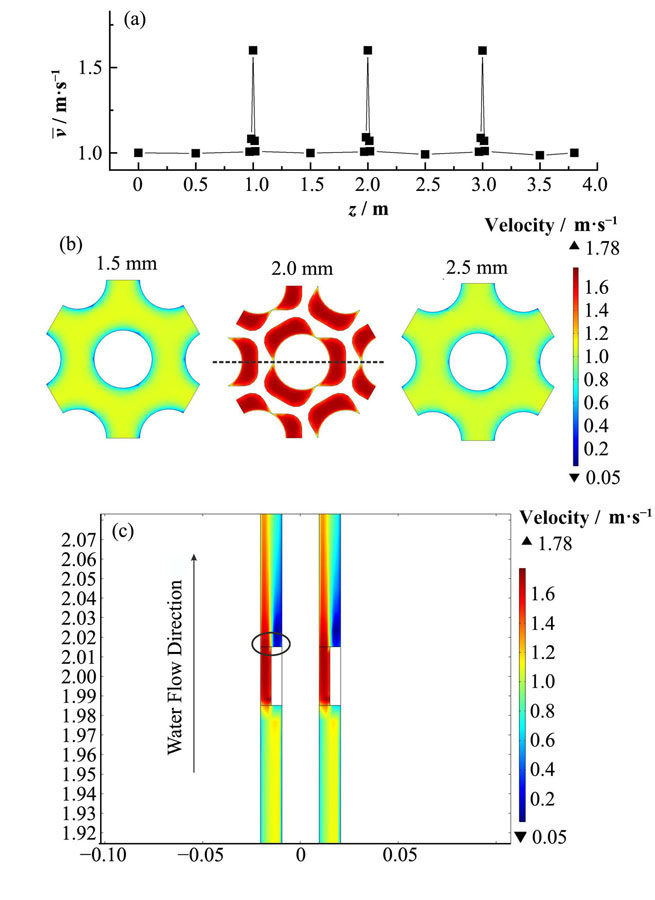
    Fig. 2. Calculated distribution of the fluid velocities in the secondary circuit model(a) Average velocity over cross sections at various heights, (b) Velocity distributions on three selected cross sections at z = 1.5 m, 2.0 m, 2.5 m, respectively, (c) Velocity distribution on the longitudinal section nearby a support plate at z = 2.0 m, see the dashed line of (b) for the location of the section
    Variation curve of average temperatures of water on different sections along the flow direction in the secondary side model
    Fig. 3. Variation curve of average temperatures of water on different sections along the flow direction in the secondary side model
    Variation curve of the average volume fraction of gas along the flow direction on cross sections at different heights of the secondary circuit model, where the black squares indicate the locations of tube support plates
    Fig. 4. Variation curve of the average volume fraction of gas along the flow direction on cross sections at different heights of the secondary circuit model, where the black squares indicate the locations of tube support plates
    Variation curve of the pH values of the water near the heat transfer tube wall along the axis of the secondary circuit model, where the sampling point coordinates are (12.525 mm, 0, z), 0≤z≤3.8 m (see the cross section of (b)). The various molar ratios of the binary alkalizers are also shown in the inset of the figure. (color online)(a) cNH3= 8.784 mol·m-3, (b) cNH3+ cETA = 4.56 mol·m-3, (c) cNH3+ cETA = 1.8 mol·m-3
    Fig. 5. Variation curve of the pH values of the water near the heat transfer tube wall along the axis of the secondary circuit model, where the sampling point coordinates are (12.525 mm, 0, z), 0≤z≤3.8 m (see the cross section of (b)). The various molar ratios of the binary alkalizers are also shown in the inset of the figure. (color online)(a) cNH3= 8.784 mol·m-3, (b) cNH3+ cETA = 4.56 mol·m-3, (c) cNH3+ cETA = 1.8 mol·m-3
    Relation curves of pH value with ETA concentration (cETA) change and change rate corresponding to two different alkalizer concentrations (1.8 mol·m-3, 4.56 mol·m-3) at z=1.5 m, 2.0 m two points respectively (shown in Fig.5)
    Fig. 6. Relation curves of pH value with ETA concentration (cETA) change and change rate corresponding to two different alkalizer concentrations (1.8 mol·m-3, 4.56 mol·m-3) at z=1.5 m, 2.0 m two points respectively (shown in Fig.5)

    材料

    Material

    导热系数

    Thermal conductivity / W·(m·K)-1

    恒压热容Heat capacity at constant

    pressure / J·(kg·K)-1

    密度

    Density / kg·cm-3

    Inconel690175248 091
    304SS195057 746
    Table 1. Physical parameters of relevant materials
    解离常数Dissociation constant相对挥发度Relative volatility
    温度Temperature / K298.15425.15573.15298.15425.15573.15
    氨NH34.755.106.67309.553.31
    乙醇胺ETA4.54.826.200.010.090.33
    Table 2. The dissociation constant and relative volatility of NH3 and ETA at different temperatures

    NH3:ETA浓度的预设配比

    The assumed concentration ratio (NH3 :ETA)

    8∶11∶04∶12∶11∶11∶21∶41∶8

    二回路中NH3浓度

    The assumed concentrations of NH3, c1 / mol·m-3

    4.054.563.653.042.281.520.910.51

    二回路中ETA浓度

    The assumed concentrations of ETA, c2 / mol·m-3

    0.5100.911.522.283.043.654.05
    Table 3. The calculated concentrations of NH3 and ETA in the secondary circuit model with c1+c2 = 4.56 mol·m-3

    NH3:ETA浓度的预设配比

    The assumed concentration ratio (NH3 :ETA)

    1∶11∶08∶14∶12∶11∶21∶41∶8

    二回路中NH3浓度

    The assumed concentrations of NH3, c1 / mol·m-3

    0.91.81.61.441.20.60.360.2

    二回路中ETA浓度

    The assumed concentrations of ETA, c2 / mol·m-3

    0.900.20.360.61.21.441.6
    Table 4. The calculated concentrations of NH3 and ETA in the secondary circuit model with c1+c2 = 1.8 mol·m-3
    热力学参数Thermodynamic parameters液相Liquid汽相Gas
    密度Density / kg·m-3740.25
    比热容Specific heat capacity / J·(g·K)-15.396 21.990 6
    液相动力黏度Dynamic viscosity, liquid phase / Pa·s9.138×10-5
    导热系数Thermal conductivity / W·(m·K)-10.569 10.048 7
    Table 5. Thermodynamic parameters of water in its gas and liquid states
    边界 Boundary类型 Type数值 Value
    入口(z=0 m) Inlet

    水流速度 / m·s-1

    水流温度 / K

    1.0

    543.15

    出口(z=3.8 m) Outlet水流压强 / MPa6.81
    传热管壁Heat transfer tube wall热通量 / W·m-2170 000~10 000z (0<z≤3.0)
    170 000~30 000z (3<z≤3.8)
    Table 6. The boundary values of main parameters
    Faliang XIAO, Tingting ZHONG, Weiling FU, Xiaoyan KANG, Shuiquan DENG. Distribution of pH values in a model simulating the secondary side of a steam generator[J]. NUCLEAR TECHNIQUES, 2022, 45(11): 110602
    Download Citation