
Jingxuan Wang, Yi Wang, Jiachen Zhang, Huaiyu Cai, Xiaodong Chen. Target and Decoding Method Based on Projective Invariance Principle[J]. Laser & Optoelectronics Progress, 2021, 58(13): 1312001
- Laser & Optoelectronics Progress
- Vol. 58, Issue 13, 1312001 (2021)
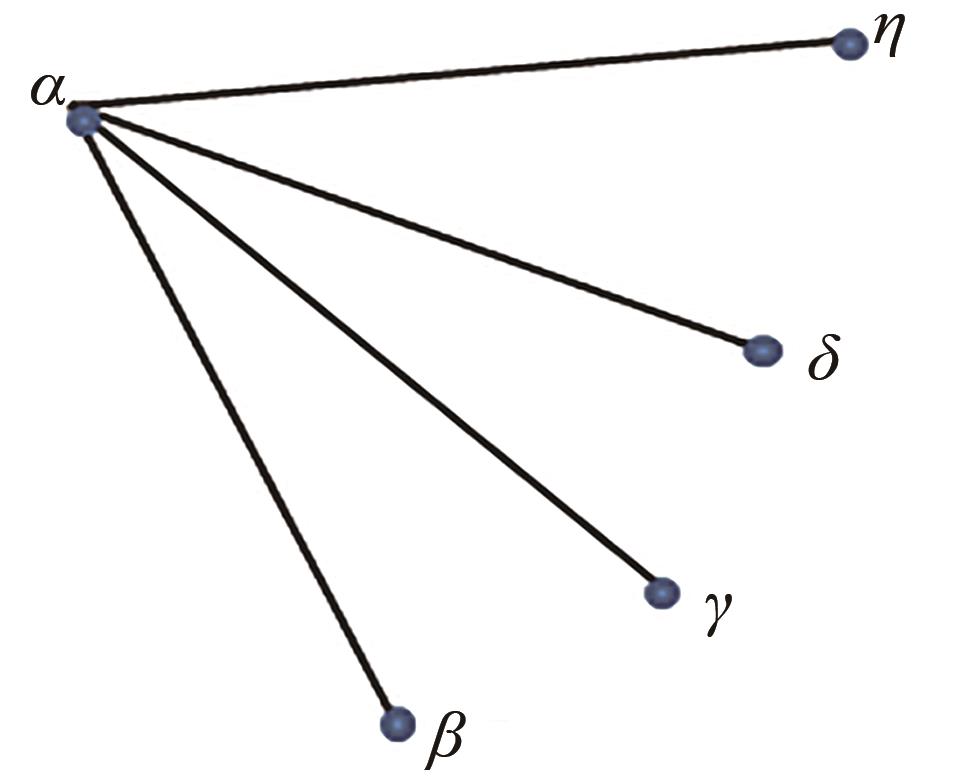
Fig. 1. Wiring harness diagram
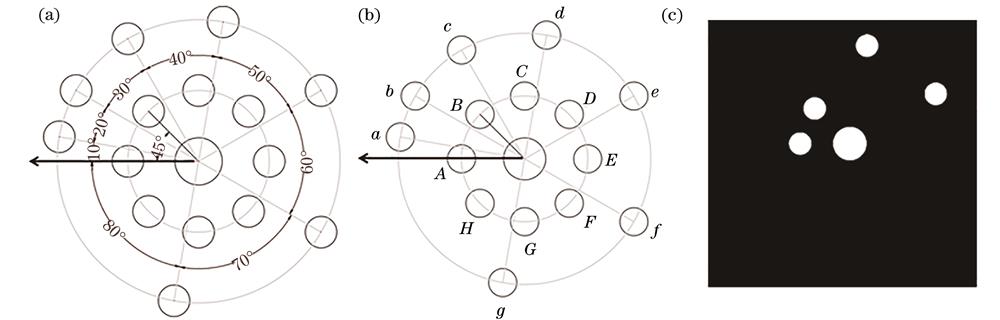
Fig. 2. Coding target composition. (a) Target templates; (b) corresponding name of coding circle; (c) example of coding targets
Fig. 3. Three wire harnesses for one target. (a) Situation 1; (b) situation 2; (c) situation 3
Fig. 4. Decoding process of target
Fig. 5. Experiment scenes and some equipment. (a) Experimental test scenarios; (b) goniometer; (c) three targets for test
Fig. 6. White boards shot at different oblique angles. (a)
Fig. 7. Error bar graphs of 9 targets at different inclination angles
Fig. 8. Plane target coordinate system
Fig. 9. Cylindrical coordinate system
Fig. 10. Mean difference of cross ratio between plane and cylinder of target
Fig. 11. Schematic of commonly used traditional targets. (a) Hattori target template; (b) Hattori target; (c) Schnerider target template; (d) Schnerider target
Fig. 12. Decoding accuracy rate of three targets at different tilt angles
|
Table 1. Decoding accuracy at different tilt angles
|
Table 2. Error mean and variance of 9 targets at different tilt angles

Set citation alerts for the article
Please enter your email address
© Copyright 2018-2021 | Chinese Laser Press. All Rights Reserved 沪ICP备15018463号-20