
Hao-ran LIU, Qi-hou HU, Wei TAN, Wen-jing SU, Yu-jia CHEN, Yi-zhi ZHU, Jian-guo LIU. Study of the Urban NO2 Distribution and Emission Assessment Based on Mobile MAX-DOAS Observations[J]. Spectroscopy and Spectral Analysis, 2021, 41(1): 11
- Spectroscopy and Spectral Analysis
- Vol. 41, Issue 1, 11 (2021)
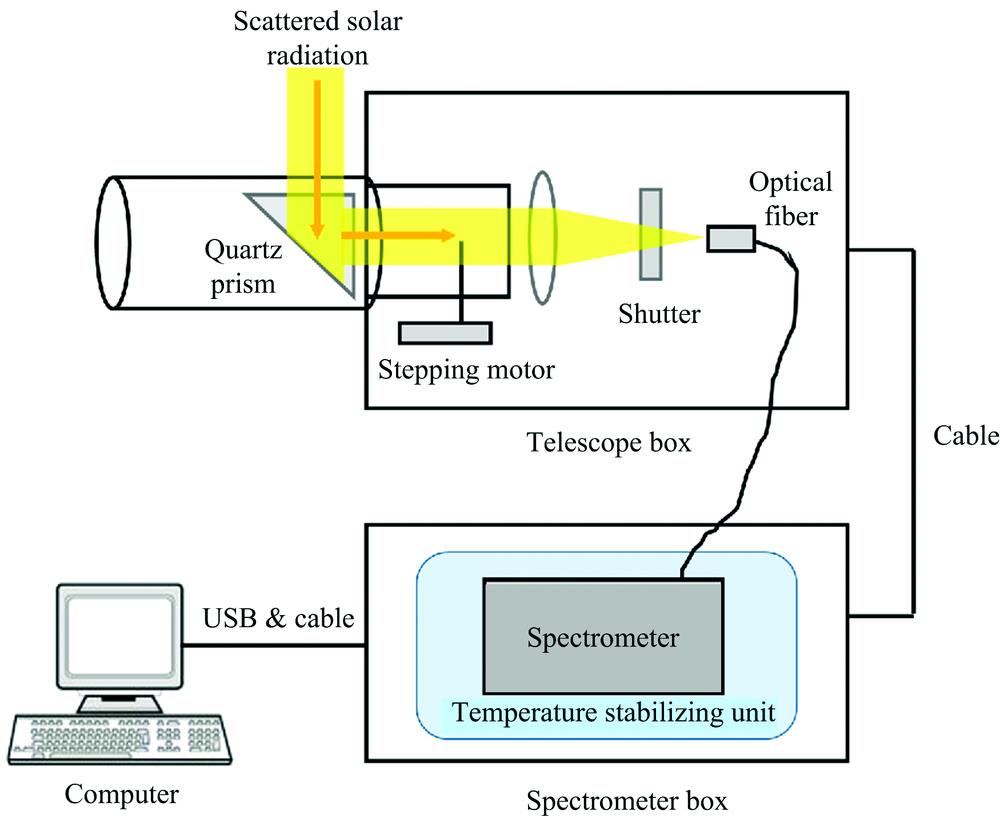
Fig. 1. Schematic diagram of the experimental setup of the MAX-DOAS instrument
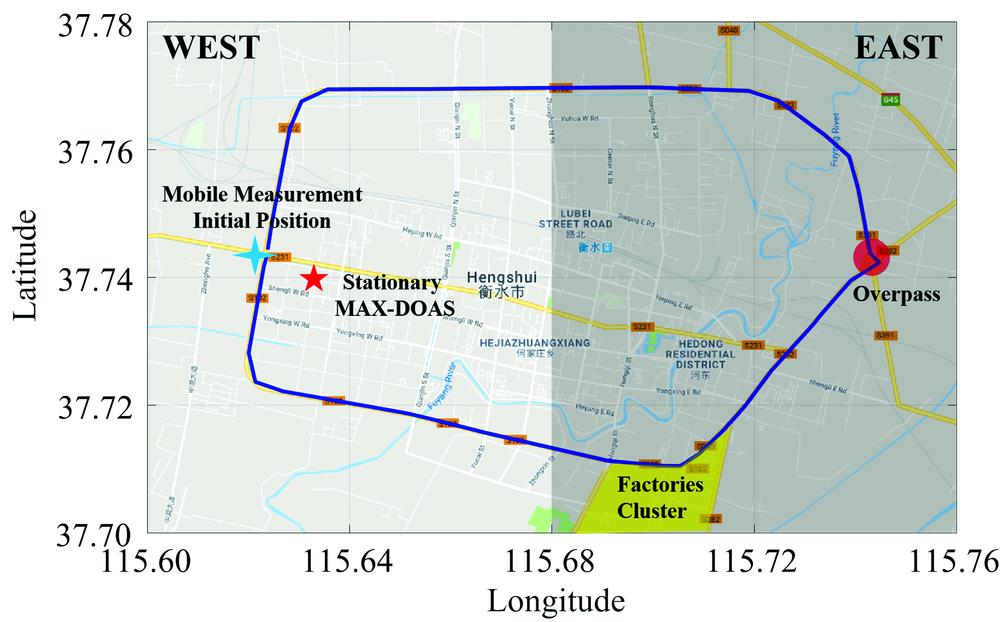
Fig. 2. The measurement routes taken and Hengshui city structure during this campaign
Fig. 3. NO2 fitting case of a measurement spectrum
Fig. 4. NO2 time series (a) and correlation (b) between the stationary and mobile MAX-DOAS during the inter-comparison measurement
Fig. 5. Spatial distribution of NO2 VCDs and the wind information during this campaign
The black arrow represents the wind field information, and the red five-pointed star represents the location of the stationary MA-DOAS
The black arrow represents the wind field information, and the red five-pointed star represents the location of the stationary MA-DOAS
Fig. 6. Comparison of NO2 between the stationary and mobile MAX-DOAS during the mobile measurement on February 9, 2018
Yellow shadow: the time when the vehicle approaching the stationary MAX-DOAS;Gray shadow: time when the vehicle reached the eastern region of Hengshui
Yellow shadow: the time when the vehicle approaching the stationary MAX-DOAS;Gray shadow: time when the vehicle reached the eastern region of Hengshui
Fig. 7. Spatial distribution of tropospheric mean NO2 VCDs measured by OMI satellite from 16th Jan 2018 to 15th Feb 2018. The 0~100 m 24 h backward trajectories of air masses are also shown to illustrate the transportation of atmospheric NO2 during the measurement campaign
The green, brown and pink lines indicate the clusters in different directions
The green, brown and pink lines indicate the clusters in different directions
|
Table 1. Driving direction, wind field and weather conditions during this campaign
|
Table 2. Parameter settings used for NO2 DSCD retrieval
|
Table 3. NO2 Mean VCDs of each area of Hengshui during the mobile MAX-DOAS measurement (1015 molecule·cm-2)
|
Table 4. NO2 emissions, input and output flux from outer route of Hengshui (1024 molecs-1)

Set citation alerts for the article
Please enter your email address
© Copyright 2018-2021 | Chinese Laser Press. All Rights Reserved 沪ICP备15018463号-20