• Infrared and Laser Engineering
  • Vol. 51, Issue 1, 20210981 (2022)
Chunyu Liu1, Yi Ding1、2, Shuai Liu1, Xinghao Fan1、2, and Yunqiang Xie1、2
Author Affiliations
  • 1Key Laboratory of Space-Based Dynamic & Rapid Optical Imaging Technology, Chinese Academy of Sciences, Changchun Institute of Optics, Fine Mechanics and Physics, Chinese Academy of Sciences, Changchun 130033, China
  • 2Daheng College, University of Chinese Academy of Sciences, Beijing 100049, China
  • show less
    DOI: 10.3788/IRLA20210981 Cite this Article
    Chunyu Liu, Yi Ding, Shuai Liu, Xinghao Fan, Yunqiang Xie. Development status and trend of filter hyperspectral camera (Invited)[J]. Infrared and Laser Engineering, 2022, 51(1): 20210981 Copy Citation Text show less
    Schematic diagram of hyperspectral imaging principle
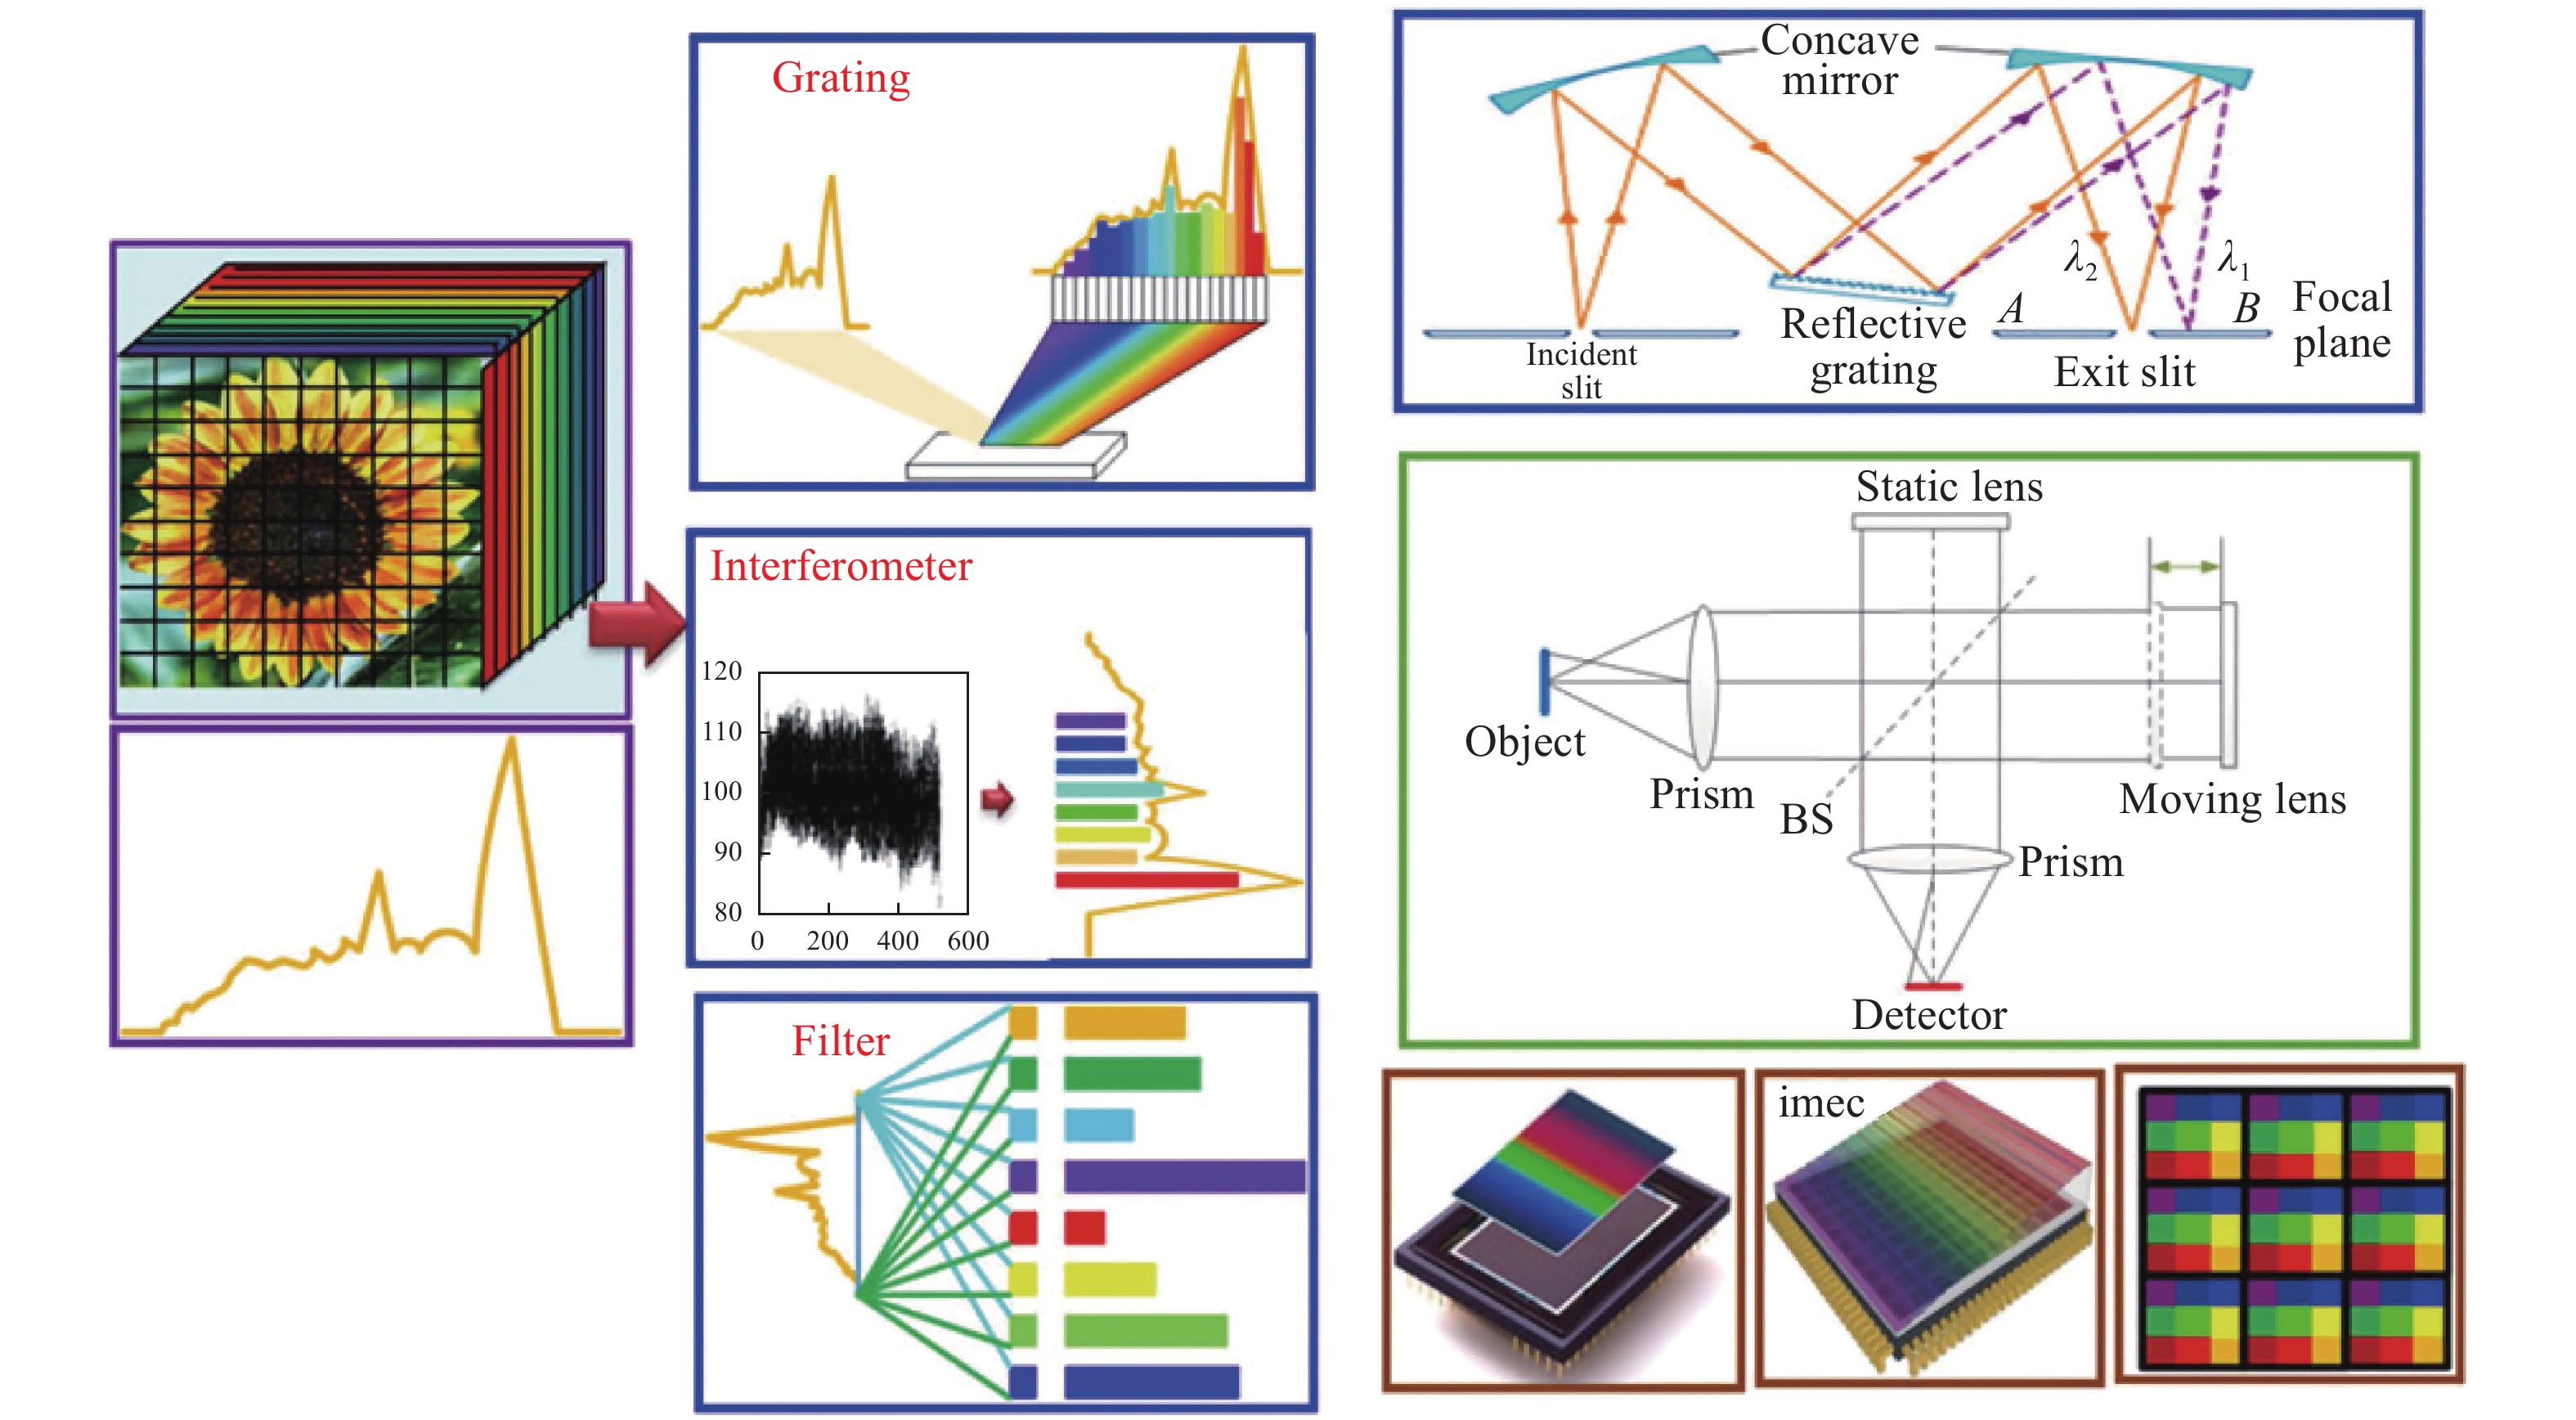
    Fig. 1. Schematic diagram of hyperspectral imaging principle
    Structure diagram of rotating filter imaging spectrometer
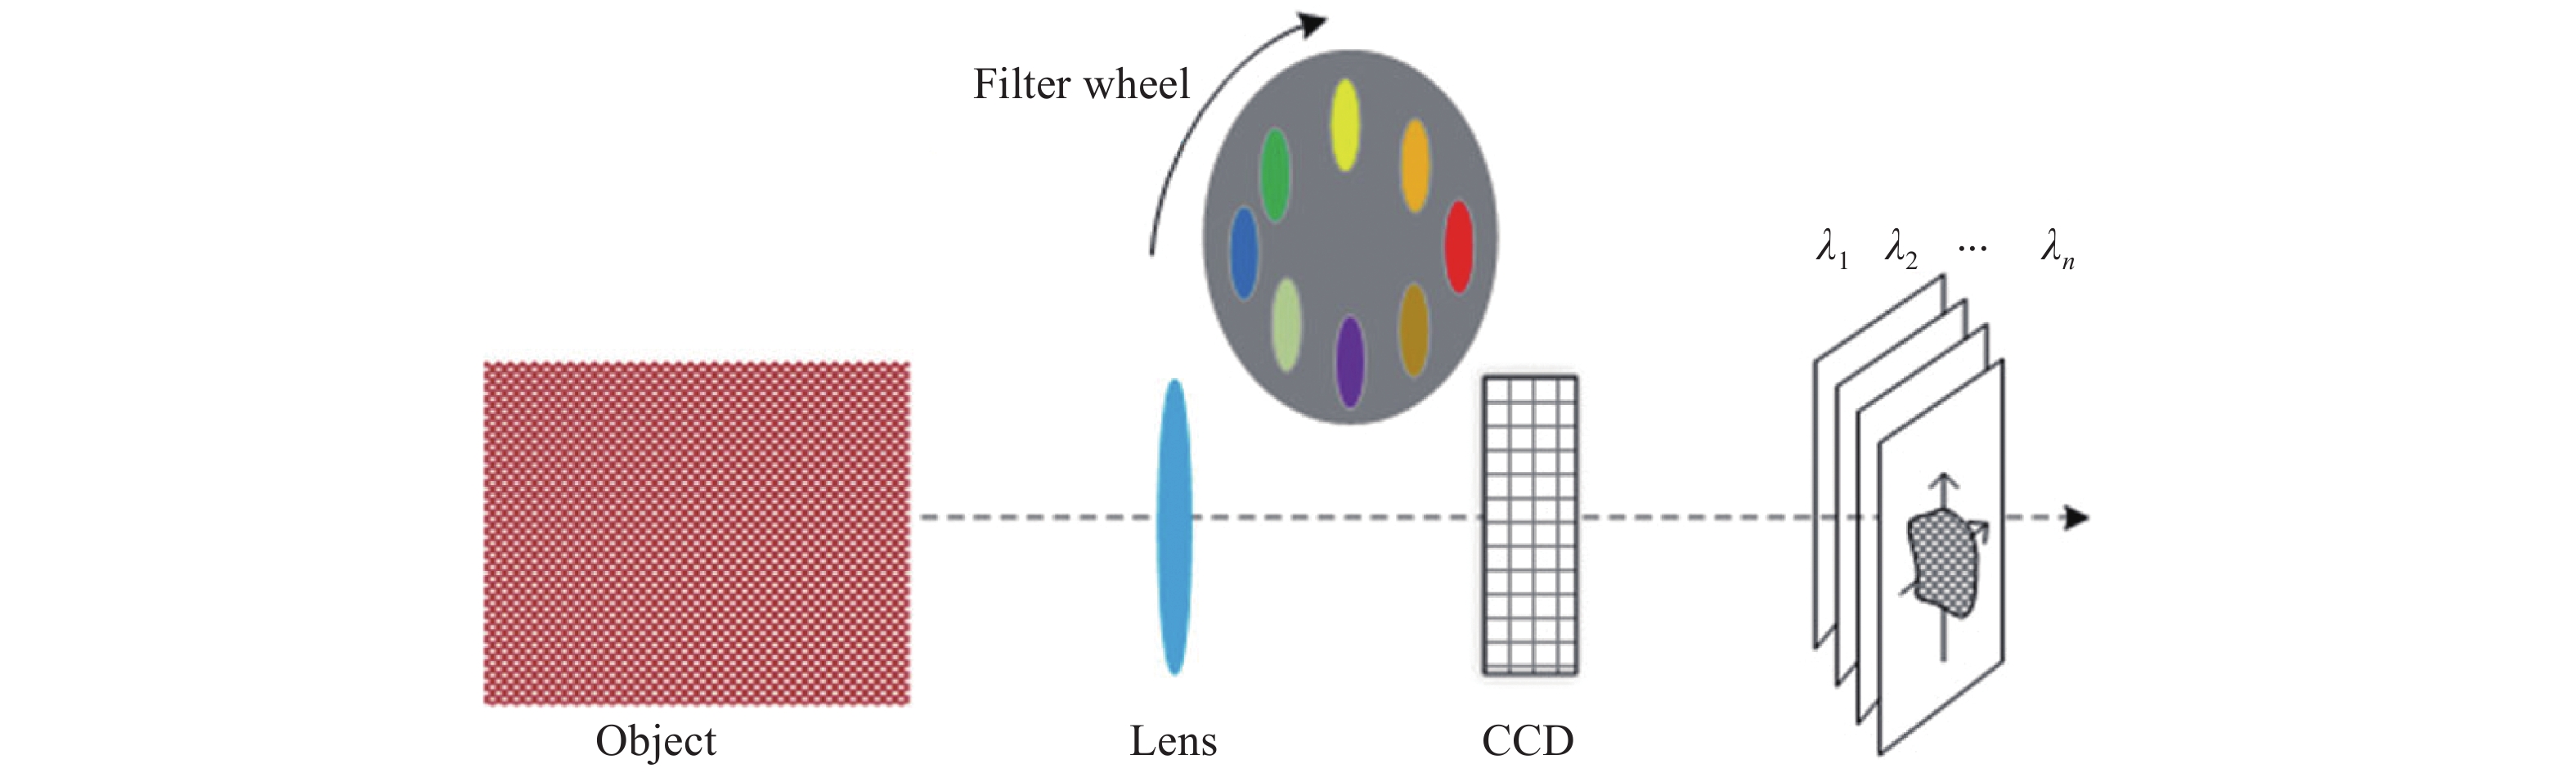
    Fig. 2. Structure diagram of rotating filter imaging spectrometer
    (a) Schematic diagram of filter wheel used in NIRSpec (b) Auxiliary structure diagram of filter wheel
    Fig. 3. (a) Schematic diagram of filter wheel used in NIRSpec (b) Auxiliary structure diagram of filter wheel
    Schematic diagram of filter wheel on MIRI
    Fig. 4. Schematic diagram of filter wheel on MIRI
    Exploded view of the design of the filter wheel mechanism
    Fig. 5. Exploded view of the design of the filter wheel mechanism
    Schematic diagram of the LCTF imaging spectrometer
    Fig. 6. Schematic diagram of the LCTF imaging spectrometer
    Structure diagram of primary Lyot filter
    Fig. 7. Structure diagram of primary Lyot filter
    Optical path diagram of HPI on Rising-2
    Fig. 8. Optical path diagram of HPI on Rising-2
    Design diagram of AOTF filter in VNIS
    Fig. 9. Design diagram of AOTF filter in VNIS
    Schematic diagram of resonant layer thickness of wedge filter
    Fig. 10. Schematic diagram of resonant layer thickness of wedge filter
    Schematic diagram of LVF structure and light splitting
    Fig. 11. Schematic diagram of LVF structure and light splitting
    (a) Schematic diagram of microwave-assisted pulse-DC rotating drum sputtering deposition system; (b) Schematic diagram of LVF
    Fig. 12. (a) Schematic diagram of microwave-assisted pulse-DC rotating drum sputtering deposition system; (b) Schematic diagram of LVF
    Light energy transmittance of filter
    Fig. 13. Light energy transmittance of filter
    Principle diagram of LVF and TDI
    Fig. 14. Principle diagram of LVF and TDI
    Schematic diagram of the arrangement of the filter array[25]
    Fig. 15. Schematic diagram of the arrangement of the filter array[25]
    (a) Bayer pattern of the filter; (b) Image under the microscope
    Fig. 16. (a) Bayer pattern of the filter; (b) Image under the microscope
    Experimental optical path of the spectrometer, from right to left is a photographic objective, a filter, a relay objective, and a panchromatic image receiver
    Fig. 17. Experimental optical path of the spectrometer, from right to left is a photographic objective, a filter, a relay objective, and a panchromatic image receiver
    Schematic diagram of 3D data cube and detector pixel coating
    Fig. 18. Schematic diagram of 3D data cube and detector pixel coating
    Physical map of filter
    Fig. 19. Physical map of filter
    (a) Schematic diagram of filter aligned with detector; (b) Schematic diagram of the actual experimental setup
    Fig. 20. (a) Schematic diagram of filter aligned with detector; (b) Schematic diagram of the actual experimental setup
    (a) Schematic diagram of 16-channel pixel-level filter; (b) Image under microscope
    Fig. 21. (a) Schematic diagram of 16-channel pixel-level filter; (b) Image under microscope
    Complete machine diagram of 16-channel imaging spectrometer
    Fig. 22. Complete machine diagram of 16-channel imaging spectrometer
    Illustration of colloidal quantum dot spectrometer system[32]
    Fig. 23. Illustration of colloidal quantum dot spectrometer system[32]
    Schematic diagram of the proposed NIR QD spectrometer[34]
    Fig. 24. Schematic diagram of the proposed NIR QD spectrometer[34]
    Pay- load Spectral range/nmFiltersCenter wavelengths and bandpass widths/nm
    ABCDEF
    UV/ VIS 415- 1000 6415/ 40 750/ 10 900/ 20 950/ 30 1000/30
    NIR1070-284061100/601250/601500/602000/602600/602780/120
    HIRES395- 800 6395- 435 535- 585 625- 675 725- 775 450- 800
    Table 1. Relevant parameters of the filter wheel used on Clementine
    Chunyu Liu, Yi Ding, Shuai Liu, Xinghao Fan, Yunqiang Xie. Development status and trend of filter hyperspectral camera (Invited)[J]. Infrared and Laser Engineering, 2022, 51(1): 20210981
    Download Citation