Quantitative phase microscopy (QPM) has emerged as an important tool for material metrology and biological imaging. For broader adoption in those applications, we have proposed and demonstrated a new portable off-axis QPM method, which works in both transmission and reflection modes to meet different sample measurement requirements. The temporal and spatial sensitivities of our system, as quantified by optical path-length difference values, are 0.65 nm and 1.04 nm, respectively. To demonstrate its applicability for a wide range of applications, we deployed our system for profiling transistor gold electrode samples, observing red blood cell membrane fluctuations, imaging living cells flowing in a microfluidic chip, etc. Our portable QPM system has a low-cost design and involves a simple and robust phase-retrieval algorithm that we envision will allow for broader deployment at different environmental settings, including in resource-limited sites and integration with other metrology or imaging modalities.
1. INTRODUCTION
Due to its noninvasive and label-free nature, quantitative phase microscopy (QPM) has recently become an important technique for biological imaging and material metrology [1–3], such as quantifying morphology and dynamics within cells and materials [4–6], cancer diagnosis [7,8], and profiling and inspecting material structures [9,10]. In recent years, several compact and low-cost QPM methods, such as those based on the twin-beam optical design [11,12], interferometer [13,14], and common-path lateral phase-shifting interferometer [15,16], have been developed for potential imaging in extreme environments, resource-limited clinical settings, and factories in industry. In most cases, those QPM systems still require an external microscope body and only work in one imaging mode, i.e., mostly in transmission mode for imaging transparent samples. On the other hand, lens-free holography techniques have allowed for extreme portability on cell-phone platforms, but complicated and time-consuming computation is required, while often quantitative phase values cannot be obtained [17,18]. Several other computation-based QPM methods have also been developed to enable portability, such as those based on Fourier ptychographic microscopy (FPM) [19,20], near-field blind ptychographic modulation [21], and transport of intensity equation (TIE) [22].
In this paper, we propose and demonstrate a new portable single-shot QPM method that works in both transmission and reflection modes. Our system is based on a common-path off-axis interferometry design, derived from the widely used laser-illumination diffraction phase microscopy [23,24], but involving simple and low-cost optical components that are configured to achieve a compact and robust design. The system is connected externally through USB ports, making it easily transportable for imaging at different research laboratories, resource-limited sites, and integration with other metrology or imaging modalities. The temporal and spatial phase sensitivities of our system, measured as optical path-length difference (OPD) values, are 0.65 nm and 1.04 nm, respectively. We characterized the performance of our QPM system by profiling different home-prepared calibration samples and standard reference material samples, and the results were further compared with those from standard atomic force microscopes (AFMs) as well as the manufacturers’ specifications. To demonstrate its broad applicability, we deployed our portable QPM system at different application settings, including profiling clean-room fabricated device structures, quantifying red blood cell (RBC) membrane fluctuations, imaging live cells flowing in microfluidic devices, etc.
2. SYSTEM DESIGN
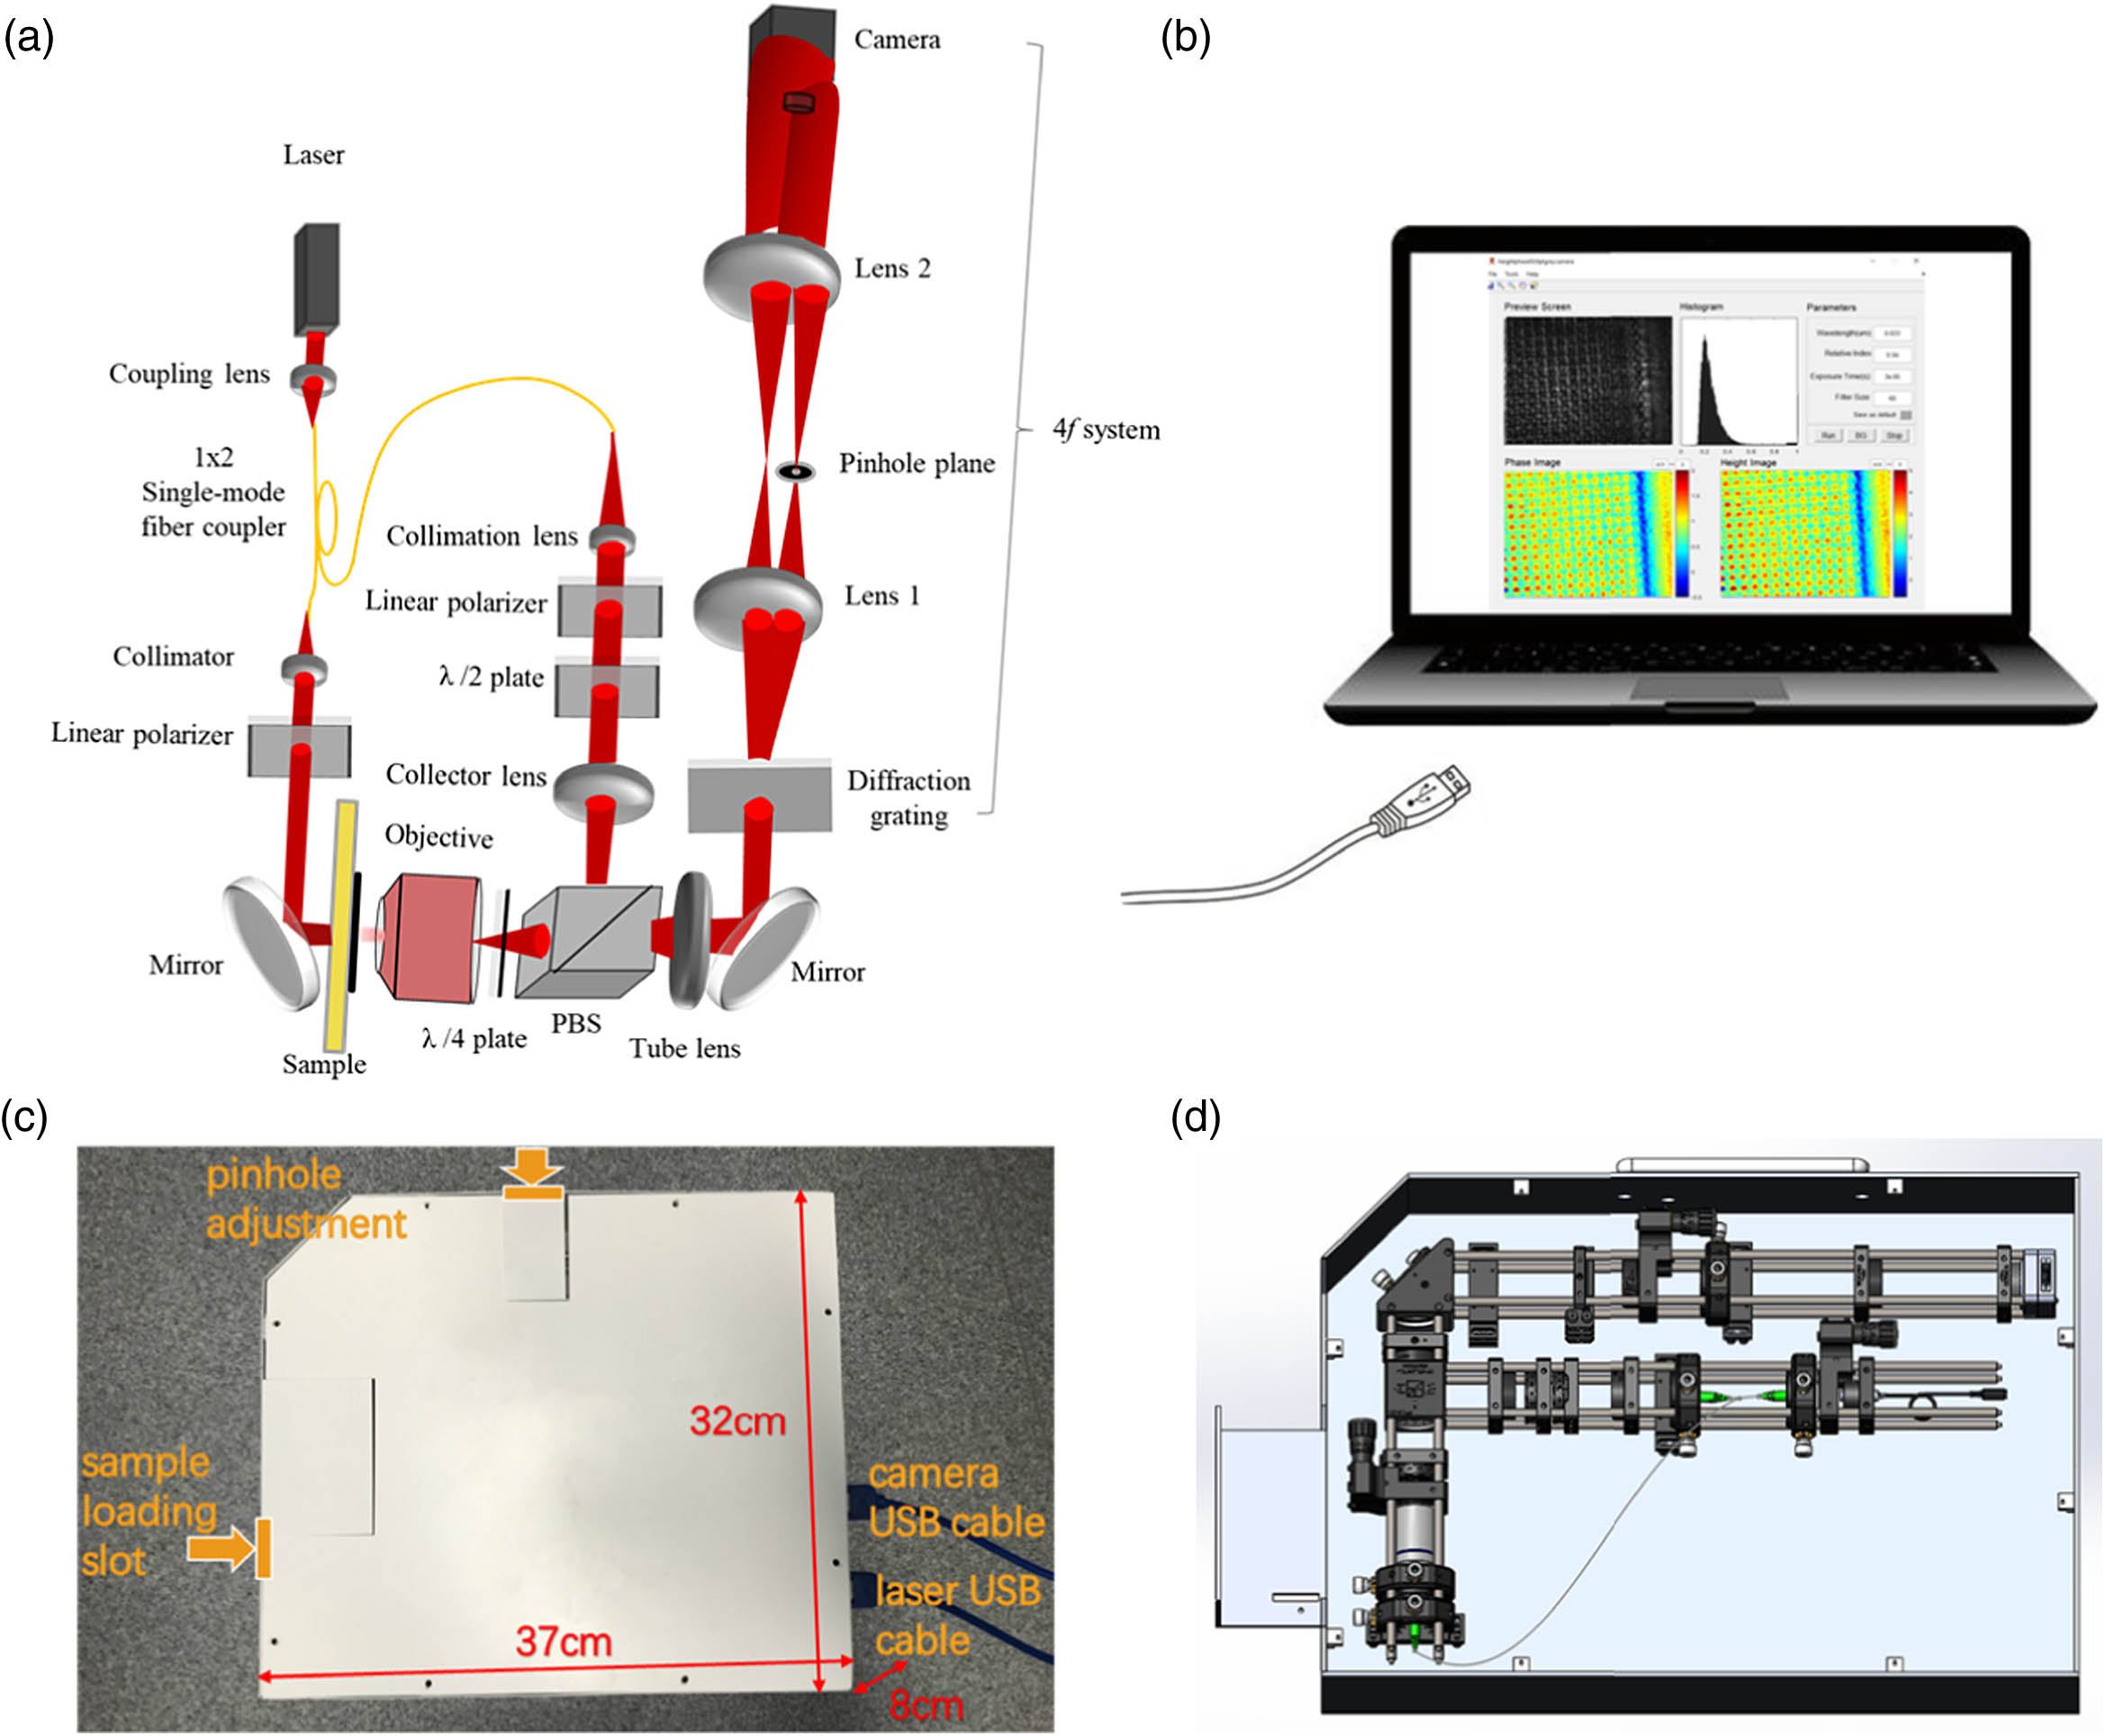
Figure 1(a) shows the schematic design of our portable QPM system, which consists of three main parts: (i) illumination system; (ii) microscopic imaging system; and (iii) common-path interferometer system. For the illumination system, a 633 nm laser pointer (Model No. CPS635, Thorlabs) with an output power of 4.5 mW is used. The laser is coupled into the input end of a single-mode fiber coupler (Model No. TN632R3A1, Thorlabs), where one output is used for transmission-mode sample illumination, and the other output is used for reflection-mode sample illumination. For the reflection-mode light path, the 633 nm laser is first expanded to about 10 mm in diameter and then made linearly polarized after a linear polarizer (Model No. LPVISE100-A, Thorlabs). A half-wave plate (Model No. WPMH05M-633, Thorlabs) in Fig. 1 is used to rotate the polarization to 0° along the horizontal axis before entering the polarization beam splitter (PBS). The laser beam is reflected to the left-hand side for sample illumination and imaged through a microscope objective lens (, LD A-Plan, Zeiss). The collector lens and the objective lens form a system to ensure a uniform and collimated beam illuminating the sample in the field of view. After the beam is reflected off the sample, an imaging field is created that carries the sample structural information in the phase of the imaging field. A quarter-wave plate (Model No. WPMQ05M-633, Thorlabs), placed between the PBS and the objective, is used to rotate the imaging field polarization axis by 90° (i.e., along the vertical axis). Therefore, the laser beam containing the imaging field would only go along the right-hand-side port of the PBS and form an image after the tube lens. Essentially, the half-wave plate, quarter-wave plate, and the linear polarizer serve as an isolator to ensure that the laser beam path is unidirectional. Then, the laser beam enters a common-path interferometer, which is based on the laser-illumination diffraction phase microscopy (DPM) design [23,24]. A 110 lpm diffraction grating (Model No. 46-074, Edmund Optics), located at the intermediate image plane, is used to create multiple image orders. The 0th diffraction order is used as the imaging beam, while the 1st diffraction order is used as the reference beam. Both 0th and 1st orders are focused down by a Fourier lens of 35 mm focal length. On the Fourier plane, a 5 μm pinhole (Model No. P5D, Thorlabs) is used as a low-pass filter for the 1st-order beam. After the pinhole, another system is formed with a 75 mm focal length lens, after which the collimated reference beam and the sample beam interfere with each other to form the interferogram at the final image plane. A USB camera (Model No. FL3-U3-13Y3M-C, FLIR Systems), placed at the image plane, is used to capture the interferogram, from which the phase of the imaging field can be retrieved using a standard Fourier-transform-based method [24]. For the transmission-mode light path, it is simply achieved by adding a collimator and a linear polarizer right after the fiber coupler output end. The rest of the light path follows that of the reflection mode. To avoid astigmatism in the imaging system, the imaging beam coming from the 0th diffraction order of the grating always travels through the center of the lenses. Note that, when switching the operation mode, the sample holder does not necessarily need to be changed. We only need to block the illumination source in transmission or reflection mode to separate the operation, e.g., when operating in the reflection mode, we block the illumination source in the transmission mode.
Sign up for Photonics Research TOC. Get the latest issue of Photonics Research delivered right to you!Sign up now
Figure 1.(a) Schematic design of the portable QPM system. (b) Software GUI running on the laptop. (c) Actual portable QPM system. (d) Internal components of the portable QPM system.
Our system has a magnification of and a field of view of μμ. With the above optical design and proper selection of the optical components, the actual system has a full dimension of less than . The system is also enclosed in a slightly larger cover (size of ), as shown in Fig. 1(c), to allow for transporting the system around different testing sites. Figure 1(d) shows the internal system configuration. Note that this system does not require other external components, such as microscope body, power control unit, and sample stage. The total hardware cost for this system is around 4000 USD. Considering other related expenses, the cost of ownership of this system can be made as low as around 5000 USD, which is significantly cheaper than any similar commercial systems. By simply connecting the camera and powering the laser source through USB ports on a laptop, as shown in Fig. 1(b), the system is made ready for imaging different samples, depending on the application requirements. On the laptop, a home-developed software with a graphic user interface (GUI) for phase retrieval and simple image processing is installed.
3. PHASE RETRIEVAL AND PHASE SENSITIVITY
To reconstruct the phase map of the sample, we used a Fourier-transform-based phase-retrieval algorithm that has been widely used in diffraction phase microscopy [24,25]. This algorithm is relatively simple, as it mainly needs the following numerical operations: (1) perform Fourier transform of the captured sample interferogram and the calibration interferogram (i.e., the interferogram measured in the sample-free region), respectively; (2) bandpass filter their corresponding st orders and shift them to the baseband; (3) inverse Fourier transform of each baseband signal to obtain the complex imaging field and the complex calibration field, respectively; (4) obtain the phase map by calculating the argument of the ratio of the complex imaging field and the complex calibration field; (5) perform phase unwrapping to obtain the final phase map. As our phase map is retrieved through interferometry, its values are well-defined as the analytical solutions of the fringe modulation equation. Therefore, our phase-retrieval result is robust. As the phase-retrieval algorithm is simple and can be parallelized, it can potentially allow for real-time phase imaging as demonstrated earlier [26]. However, for computation-based phase-imaging methods (e.g., lens-free holography, FPM, TIE) [18,19,22], multiple intensity images are normally measured, and sophisticated phase-retrieval algorithms are developed to retrieve the phase maps with extensive computations. As only intensity images are measured, the retrieved absolute phase values can be algorithm-dependent.
Interferometry-based QPM methods are sensitive to external mechanical vibrations, which can be minimized through a common-path design [24]. At the same time, a compact system design can minimize the light travel distance to effectively reduce the effect of mechanical vibration. Phase noise, often characterized by the optical path-length difference (OPD), is an important parameter to characterize the stability of a QPM system. In the absence of samples, we measured 300 interferograms at 100 fps (frames per second) and retrieved their corresponding phase maps for noise characterization, following a similar procedure in Refs. [25,27]. Figure 2(a) shows the histogram of the OPD values for all the pixels of the 300 frames. The distribution has a standard deviation of 1.04 nm, which is used as the phase spatial noise value. Figure 2(c) shows the histogram of the OPD standard deviation values, calculated for each pixel over time. The mean value of the histogram is 0.65 nm, which is used as the phase temporal noise. Both the spatial and the temporal phase noise values are comparable with the laser-based QPM systems reported earlier [25,27]. According to a recent study [27], the phase noise is ultimately related to the photon shot noise, which determines the phase sensitivity to be around , where is the electron well capacity. As most cameras have an electron well capacity of around 10,000 to 60,000 electrons, the phase noise after converting to the OPD value is therefore normally on the order of 1 nm. Figure 2(b) shows the temporal fluctuation of the frame-averaged OPD value over 3 s, while Fig. 2(d) shows the OPD map that is averaged over all the 300 frames.
Figure 2.(a) Histogram of the OPD values for all the pixels of all the frames. (b) Temporal fluctuation of the frame-averaged OPD value. (c) Histogram of the OPD standard deviation values. (d) OPD map averaged over all the frames.
According to the Abbe criterion, the lateral resolution of our imaging system is μ (or the full-pitch resolution). To further validate the resolution of the system, we measured the NIST reference material (RM) 8820 sample [28]. Figure 3(a) shows the SEM image of the structure’s label as L500 nm S500 nm and L500 nm S1000 nm lines. Figure 3(b) shows the phase map obtained from our portable QPM system. In the inset figure in Fig. 3(b), we plot the line profile of the L500 nm S500 nm lines as indicated by the white dotted line in the rectangular box, from which we clearly resolve each individual line. We also fit the measured profile to a sinusoidal function and determine the line period to be 0.96 μm, which agrees with the 1 μm value as documented.
Figure 3.(a) Typical SEM image for a portion of the NIST reference material (RM) 8820 sample showing the L500 nm S500 nm and L500 nm S1000 nm lines (figure adapted from Ref. [28]). (b) Phase map measured by the portable QPM system. Inset figure shows the line profile indicated by the white dotted line.
Furthermore, we explored the height measurement accuracy of our portable QPM system by measuring several calibration samples. For reflection-mode testing, we fabricated the gold electrodes (source and drain electrodes for making field-effect transistor structures) by depositing Au patterns on substrate, as shown in Fig. 4(a). An Au structure with a thickness of 60 nm was deposited by thermal deposition and photolithography. Then, another 15 nm Au layer was deposited over the whole device to make the sample fully reflective, so that we could measure the height profile of Au patterns. Using our portable QPM system, we reconstructed the surface height map for a portion of the device as shown in Fig. 4(b). We selected two areas, with one on the Au structure and the other on the bottom structure, as indicated by the black dotted boxes; then, we plotted the height histogram, as shown in Fig. 4(d). From the histogram, we determined the average height and its standard deviation (SD) on the Au structure region to be about 65.70 nm and 4.06 nm, respectively. In order to validate the measurement accuracy, we measured the height maps of the same pattern area with an AFM system (Nanoscope IIIa, Bruker) in the tapping mode, as shown in Fig. 4(d). Similarly, we plotted the height histogram for the selected areas and determined the average height of the Au structure to be about 64.85 nm and its standard deviation to be about 5.25 nm. The values are in a good agreement with our QPM measurements. Note that the SD values in both systems are similar but much larger than the phase spatial noise of around 1 nm, which is probably due to the surface roughness of the Au structure surface. Note that it took more than 10 min to acquire a size image from AFM, while the same image only required a few milliseconds from our portable QPM system. In our system, the phase map is converted to the height map, , with the following transformations for transmission mode and reflection mode, respectively: where is the phase map, and is the wavelength of the laser source. For transmission mode height calculation using Eq. (1a), is the refractive index contrast between the sample and the medium. For reflection mode height calculation using Eq. (1b), as light travels in the air first to the surface of the sample and then gets reflected, there is a factor of 2, which accounts for the double-pass, i.e., is replaced with 2.
Figure 4.(a) Design of the gold electrodes in transistor sample. (b) Height map of the sample from the portable QPM system; inset figure shows the line profile along the white dotted line in (b). (c) AFM image of the sample (Software: NanoScope Analysis 1.5); inset figure shows the line profile along the white dotted line in (c). (d) Height histogram of the Au structure area and the bottom area selected in (b). (e) Height histogram of the Au structure area and the bottom area selected in (c).
For transmission-mode testing, we used standard spherical polystyrene beads with a refractive index value of 1.59 and a diameter of 5 μm (Part No. 4205A, Thermo Fisher). These beads were suspended in the index-matching liquid (Cargille Labs), which has a matched refractive index value of 1.57. A height map retrieved from our system, containing three beads, is shown in Fig. 5(a). Figure 5(b) shows the line profile for the beads in the yellow rectangle area, whose height is determined to be around 5 μm.
Figure 5.(a) Height map of 5 μm beads. (b) Line profile along the yellow arrow direction for the bead indicated in (a).
To demonstrate broad applicability of our portable QPM system, we conducted measurements of different material and biological samples under various conditions using either the reflection mode or the transmission mode. In the following, we show several representative material metrology and biological imaging examples.
A. Material Structure Metrology
Under the reflection-mode, we measured the NIST reference material (RM) 8820, which has been widely used as a calibration sample in industry. The mean height and the height standard deviation of the sample features were documented to be 97.3 and 1.6 nm, respectively [28]. Figures 6(a) and 6(b) show the measured height or topography map for a portion of the sample whose corresponding scanning electron microscope (SEM) image is shown in Fig. 6(c). According to the topography histogram shown in Fig. 6(d), the mean height is determined to be about 93.41 nm, while the height standard deviation for the feature area is determined to be about 7.4 nm. Our measured height standard deviation value is higher than the reference, which could be due to the sample contamination and the laser speckles.
Figure 6.(a) Height map for a selected region in the NIST reference material (RM) 8820 sample. (b) Zoom-in height map for the selected area in (a). (c) SEM image of the selected area (figure adapted from Ref. [28]). (d) Histogram of the topography map in (b).
QPM has been widely used to quantify the morphology and dynamics of human red blood cells (RBCs), from which their mechanical properties can be extracted for rapid disease diagnosis, such as anemia and blood infection [29–31]. Due to its portability and robustness, our QPM system can be used for RBC-related pathophysiological studies and disease diagnoses in resource-limited settings. Under the transmission mode, we measured fresh RBCs in a phosphate-buffered saline (PBS) solution. Figures 7(a) and 7(b) show the raw interferogram and the retrieved surface height map of the RBCs, respectively. The dynamic fluctuation of the selected RBC membrane height can be observed by acquiring a time-lapse video (refer to Visualization 1). The measured quantitative morphological values of RBCs agree with previous reports [31].
Figure 7.(a) Raw interferogram of the RBCs with a zoom-in showing the fringe contrast and bending. (b) Retrieved height map of the RBCs in (a). (c) Snapshot of the membrane height fluctuation in Visualization 1 for the RBC selected in (b).
Microfluidic devices have been widely used for various cytometry applications [32,33]. Here, we show a proof-of-concept demonstration that our portable QPM system can be integrated with a microfluidic device for image cytometry applications to enable statistical analysis of large-scale cell populations. Figure 8(a) shows the actual microfluidic device and the channel geometry. The device was first mounted on the sample holder before flowing a mouse myoblast cell line (C2C12 cell line) at a rate of 2.5 mm/s in the channel. Time-lapse frames of interferograms were captured and then processed to obtain a time-lapse of phase images. Figure 8(b) shows a representative phase image demonstrating the imaging field of view of the microfluidic channel, enclosed by the yellow lines. The phase maps of a few different myoblasts, captured in the phase image time-lapse, are shown in Fig. 8(d). For statistical analysis of large-scale cell populations, one can extract the dry mass of each cell, i.e., the nonaqueous content of the cell, from the phase map [34]. The dry mass, , can be obtained using the following equation: where is the refractive index increment, and is the area of the entire projected cell area. Here, we used an average value of 0.2 mL/g for to calculate the dry mass of myoblasts from the measured phase maps. For a simple analysis, in Fig. 8(c) we plot the histogram of the dry mass distribution for the captured myoblasts. The dry mass values of the mouse myoblasts are distributed within 200–1000 pg, which is corroborated by previous reports for similar cell types [35,36]. In previous reports, Archimedes’ method was implemented in a microfluidic system to measure the density of single cells by using the suspended microchannel resonator [37]. Compared with this method, our portable QPM system can provide faster and more convenient measurements of the cell’s dry mass. For larger population cell analysis and phenotyping in practice, a more complex statistical analysis algorithm based on cell shape and dry mass can be developed.
Figure 8.(a) Actual microfluidic device and the geometry of the channels. (b) Representative phase image showing the imaging field of view of the microfluidic channel. (c) Histogram of the dry mass for all the cells captured in the microfluidic channel. (d) Phase maps of a few selected myoblasts captured in the microfluidic channel.
We have demonstrated a new low-cost portable QPM method for various material metrology and biological imaging applications. Due to its dual-imaging modality, it can be used for imaging transparent and reflective samples. Currently, the phase image processing speed is around 2 frames/s on a low-end laptop. By implementing a parallel computation scheme [26], we plan to achieve real-time phase imaging to better benefit certain applications. In the future, we expect to perform more comprehensive studies for several main applications, e.g., (1) quantifying the deformation of RBCs in microfluidic channels using phase/height maps and extracting their stiffness information for testing the RBC quality in blood banks; (2) integrating our system with other imaging/metrology modalities for in-line fabrication quality control; and (3) combining our system with microfluidic devices and a machine learning algorithm to allow for more complex cell phenotyping applications that involve analyzing large cells populations. Due to the label-free nature and the robust image-retrieval algorithm, we only need simple sample preparations and easy computation, which we believe will enable this system to be widely used in many research developments and industry applications in the future.
References
[1] G. Popescu. Quantitative Phase Imaging of Cells and Tissues(2011).
[28] M. T. Postek, A. Vladar, B. Ming, B. Benjamin. Documentation for reference material (RM) 8820: a versatile, multipurpose dimensional metrology calibration standard for scanned particle beam, scanned probe and optical microscopy(2014).