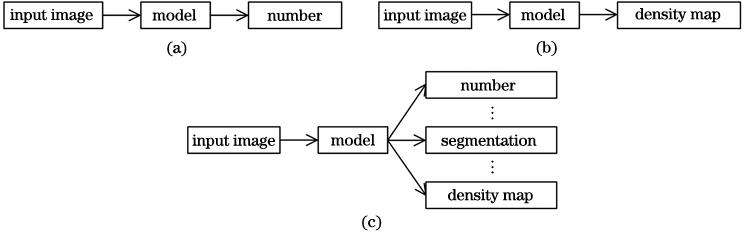
Fig. 1. Schematic diagrams of three models. (a) Regression based object counting model; (b) density estimation based object counting model; (c) multi-task model
Fig. 2. Architecture of multi-scene judgment
Fig. 3. Architecture of FCN-rLSTM
Fig. 4. Input image and generation of density map. (a) Input image; (b) generation of density map
Fig. 5. Architecture of Hydra CNN
Fig. 6. Architecture of MCNN
Fig. 7. Architecture of DecideNet
Fig. 8. Structure of network of combined loss function
Fig. 9. Architecture of SaCNN
Fig. 10. Architecture of SFANet
Fig. 11. Architecture of CAT-CNN
Fig. 12. Architecture of FCN-MT
Fig. 13. Architecture of cell segmentation network
Fig. 14. Samples from six crowd datasets. (a) UCSD; (b) Mall; (c) UCF_CC_50; (d) WorldExpo’10; (e) Shanghai Tech Part A; (f) Shanghai Tech Part B
Fig. 15. Samples from three cell datasets. (a) VGG Cells; (b) MBM Cells; (c) Adipocyte Cells
Fig. 16. Samples from two datasets. (a) WebCamT; (b) TRANCOS
Fig. 17. Estimation results on Shanghai Tech dataset generated by SFANet. The first two rows belong to Part B, and the last two rows belong to Part A
[58]. (a) Input images; (b) attention maps; (c) density maps; (d) ground truths
| Dataset | Scene | Resolution | Range | Total number of people | Image No. |
|---|
| UCSD[65] | Same | 158×238 | 11-46 | 49885 | 2000 | | Mall[66] | Same | 240×320 | 13-53 | 62325 | 2000 | | UCF_CC_50[67] | Different | Different | 99-4543 | 63974 | 50 | | WorldExpo’10[13] | Different | 576×720 | 1-253 | 199923 | 3980 | | Shanghai Tech[19] | Part A | Different | Different | 33-3139 | 241677 | 482 | | Part B | Different | 768×1024 | 9-578 | 88488 | 716 |
|
Table 1. Summary of five public pedestrian datasets
| Dataset | Resolution | Range | Total number of cells | Image No. |
|---|
| VGG Cells[17] | 256×256 | 74—317 | 35192 | 200 | | MBM Cells[40] | 600×600 | 65—193 | 5446 | 44 | | Adipocyte Cells[69] | 150×150 | 48—299 | 31017 | 200 |
|
Table 2. Summary of three public cell datasets
| Number | Method | UCSD[65] | Mall[66] | UCF_CC_50[67] | WorldExpo’10[13] | SHT A[19] | SHT B[19] |
|---|
| MAE | RMSE | MAE | RMSE | MAE | RMSE | MAE | RMSE | MAE | RMSE | MAE | RMSE |
|---|
| 1 | Shang et al.[6] | | | | | 270.3 | | 11.7 | | | | | | | 2 | CNN boosting[8] | 1.10 | | 2.01 | | 364.4 | | | | | | | | | 3 | Marsden et al.[9] | | | | | | | | | 85.7 | 131.1 | 17.7 | 28.6 | | 4 | Lempitsky et al.[17] | | | | | 493.4 | 487.1 | | | | | | | | 5 | Fiaschi et al.[21] | | | | | | | | | | | | | | 6 | MCNN[19] | 1.07 | 1.35 | | | 377.6 | 509.1 | 11.6 | | 110.2 | 173.2 | 26.4 | 41.3 | | 7 | Hydra CNN[11] | | | | | 333.7 | 425.3 | | | | | | | | 8 | Wang et al.[25] | | | | | 264.9 | 382.1 | 8.6 | | 83.7 | 124.5 | 17.9 | 32.4 | | 9 | FCN[29] | | | | | 338.6 | 424.5 | | | 126.5 | 173.5 | 23.8 | 33.1 | | 10 | A-CCNN[30] | 1.35 | | | | 367.3 | | | | | | | | | 11 | POCNet[34] | 1.24 | 1.50 | 1.82 | 5.48 | | | | | | | 12.1 | 20.3 | | 12 | DecideNet[35] | | | 1.52 | 1.90 | | | 9.23 | | | | 20.8 | 29.4 | | 13 | SPN[36] | 1.03 | 1.32 | | | 259.2 | 335.9 | | | 61.7 | 99.5 | 9.4 | 14.4 | | 14 | AM-CNN[43] | | | | | 279.5 | 377.8 | 7.84 | | 87.3 | 132.7 | 15.6 | 26.4 | | 15 | SCAR[44] | | | | | 259.0 | 374.0 | | | 66.3 | 114.1 | 9.5 | 15.2 | | 16 | Hossain et al.[46] | | | 1.28 | 1.68 | 271.6 | 391.0 | | | | | 16.9 | 28.4 | | 17 | RANet[47] | | | | | 239.8 | 319.4 | | | 59.4 | 102.0 | 7.9 | 12.9 | | 18 | ASNet[48] | | | | | 174.8 | 251.6 | 6.6 | | 57.8 | 90.1 | | | | 19 | Wang et al.[49] | | | | | 170.1 | 232.4 | 6.5 | | 57.7 | 99.7 | 7.4 | 11.1 | | 20 | Cross-scene[13] | 1.60 | 3.31 | | | 467.0 | 498.5 | 10.7 | | 181.8 | 277.7 | 32.0 | 49.8 | | 21 | FF-CNN[51] | | | | | | | | | 81.8 | 138.8 | 16.5 | 26.2 | | 22 | MMCNN[52] | 1.02 | 1.18 | 1.98 | 5.68 | 320.6 | 323.8 | 9.1 | | 91.2 | 128.6 | 18.5 | 29.3 | | 23 | DensityCNN[53] | | | | | 244.6 | 341.8 | 6.9 | | 63.1 | 106.3 | 9.1 | 16.3 | | 24 | SaCNN[55] | | | | | 314.9 | 424.8 | 8.5 | | 86.8 | 139.2 | 16.2 | 25.8 | | 25 | Sang et al.[56] | | | | | | | | | 75.8 | 124.9 | 11.0 | 18.6 | | 26 | MRA-CNN[57] | | | | | 240.8 | 352.6 | 7.5 | | 74.2 | 112.5 | 11.9 | 21.3 | | 27 | SFANet[58] | 0.82 | 1.07 | | | 219.6 | 316.2 | | | 59.8 | 99.3 | 6.9 | 10.9 | | 28 | ACCNet[59] | 1.00 | 1.27 | | | 201.6 | 282.1 | | | 64.3 | 104.1 | 8.7 | 13.6 | | 29 | CAT-CNN[60] | | | | | 235.5 | 324.8 | 7.2 | | 66.7 | 101.7 | 11.2 | 20.0 | | 30 | MSMT-CNN[61] | | | | | 319.5 | 358.1 | 9.3 | | | | | | | 31 | GMN[62] | | | | | | | | | 95.8 | 133.3 | | |
|
Table 3. Comparison of crowd counting models
| Number | Method | VGG Cells[17] | MBM Cells[40] | Adipocyte Cells[69] |
|---|
| N=32 | N=50 | N=10 | N=15 | N=25 | N=50 |
|---|
| 1 | Marsden et al.[9] | | | 21.5±4.2 | 20.5±3.5 | | | | 2 | Lempitsky et al.[17] | 3.5±0.2 | | | | | | | 3 | Fiaschi et al.[21] | 3.2±0.1 | | | | | | | 4 | FCRN-A[18] | 2.9±0.2 | 2.9±0.2 | 22.2±11.6 | 21.3±9.4 | | | | 5 | Count-ception[40] | 2.4±0.4 | 2.3±0.4 | 10.7±2.5 | 8.8±2.3 | 21.9±2.8 | 19.4±2.2 | | 6 | Cell-Net[42] | | 2.2±0.5 | 9.8±3.2 | | | | | 7 | SAU-Net[45] | | 2.6±0.4 | | 5.7±1.2 | | 14.2±1.6 | | 8 | GMN[62] | 3.6±0.3 | | | | | |
|
Table 4. Comparison of cell counting models
| Number | Method | WebCamT[12] | TRANCOS[11] |
|---|
| Downtown | Parkway | GAME 0 | GAME 1 | GAME 2 | GAME 3 |
|---|
| 1 | Lempitsky et al.[17] | 5.91 | 5.19 | 13.76 | 16.72 | 20.72 | 24.36 | | 2 | Fiaschi et al.[21] | | | 17.77 | 20.14 | 23.65 | 25.99 | | 3 | Marsden et al.[9] | | | 9.70 | | | | | 4 | FCN-rLSTM[10] | 1.53 | 1.63 | 4.38 | | | | | 5 | CCNN[11] | | | 12.49 | 16.58 | 20.02 | 22.41 | | 6 | Hydra-CNN[11] | 3.55 | 3.64 | 10.99 | 13.75 | 16.69 | 19.32 | | 7 | AMDCN[24] | | | 9.77 | 13.16 | 15.00 | 15.87 | | 8 | CSRNet[27] | | | 3.56 | 5.49 | 8.57 | 15.04 | | 9 | DensityCNN[53] | | | 3.17 | 4.78 | 6.30 | 8.26 | | 10 | FCN-MT[12] | 2.74 | 2.52 | 5.31 | | | |
|
Table 5. Comparison of vehicle counting models