
Mario Ferianis, Enrico Allaria, Eugenio Ferrari, Giulio Gaio, Giuseppe Penco, Fabio Rossi, Marco Veronese. How the optical timing system, the longitudinal diagnostics and the associated feedback systems provide femtosecond stable operation at the FERMI free electron laser[J]. High Power Laser Science and Engineering, 2016, 4(2): 02000e13
- High Power Laser Science and Engineering
- Vol. 4, Issue 2, 02000e13 (2016)
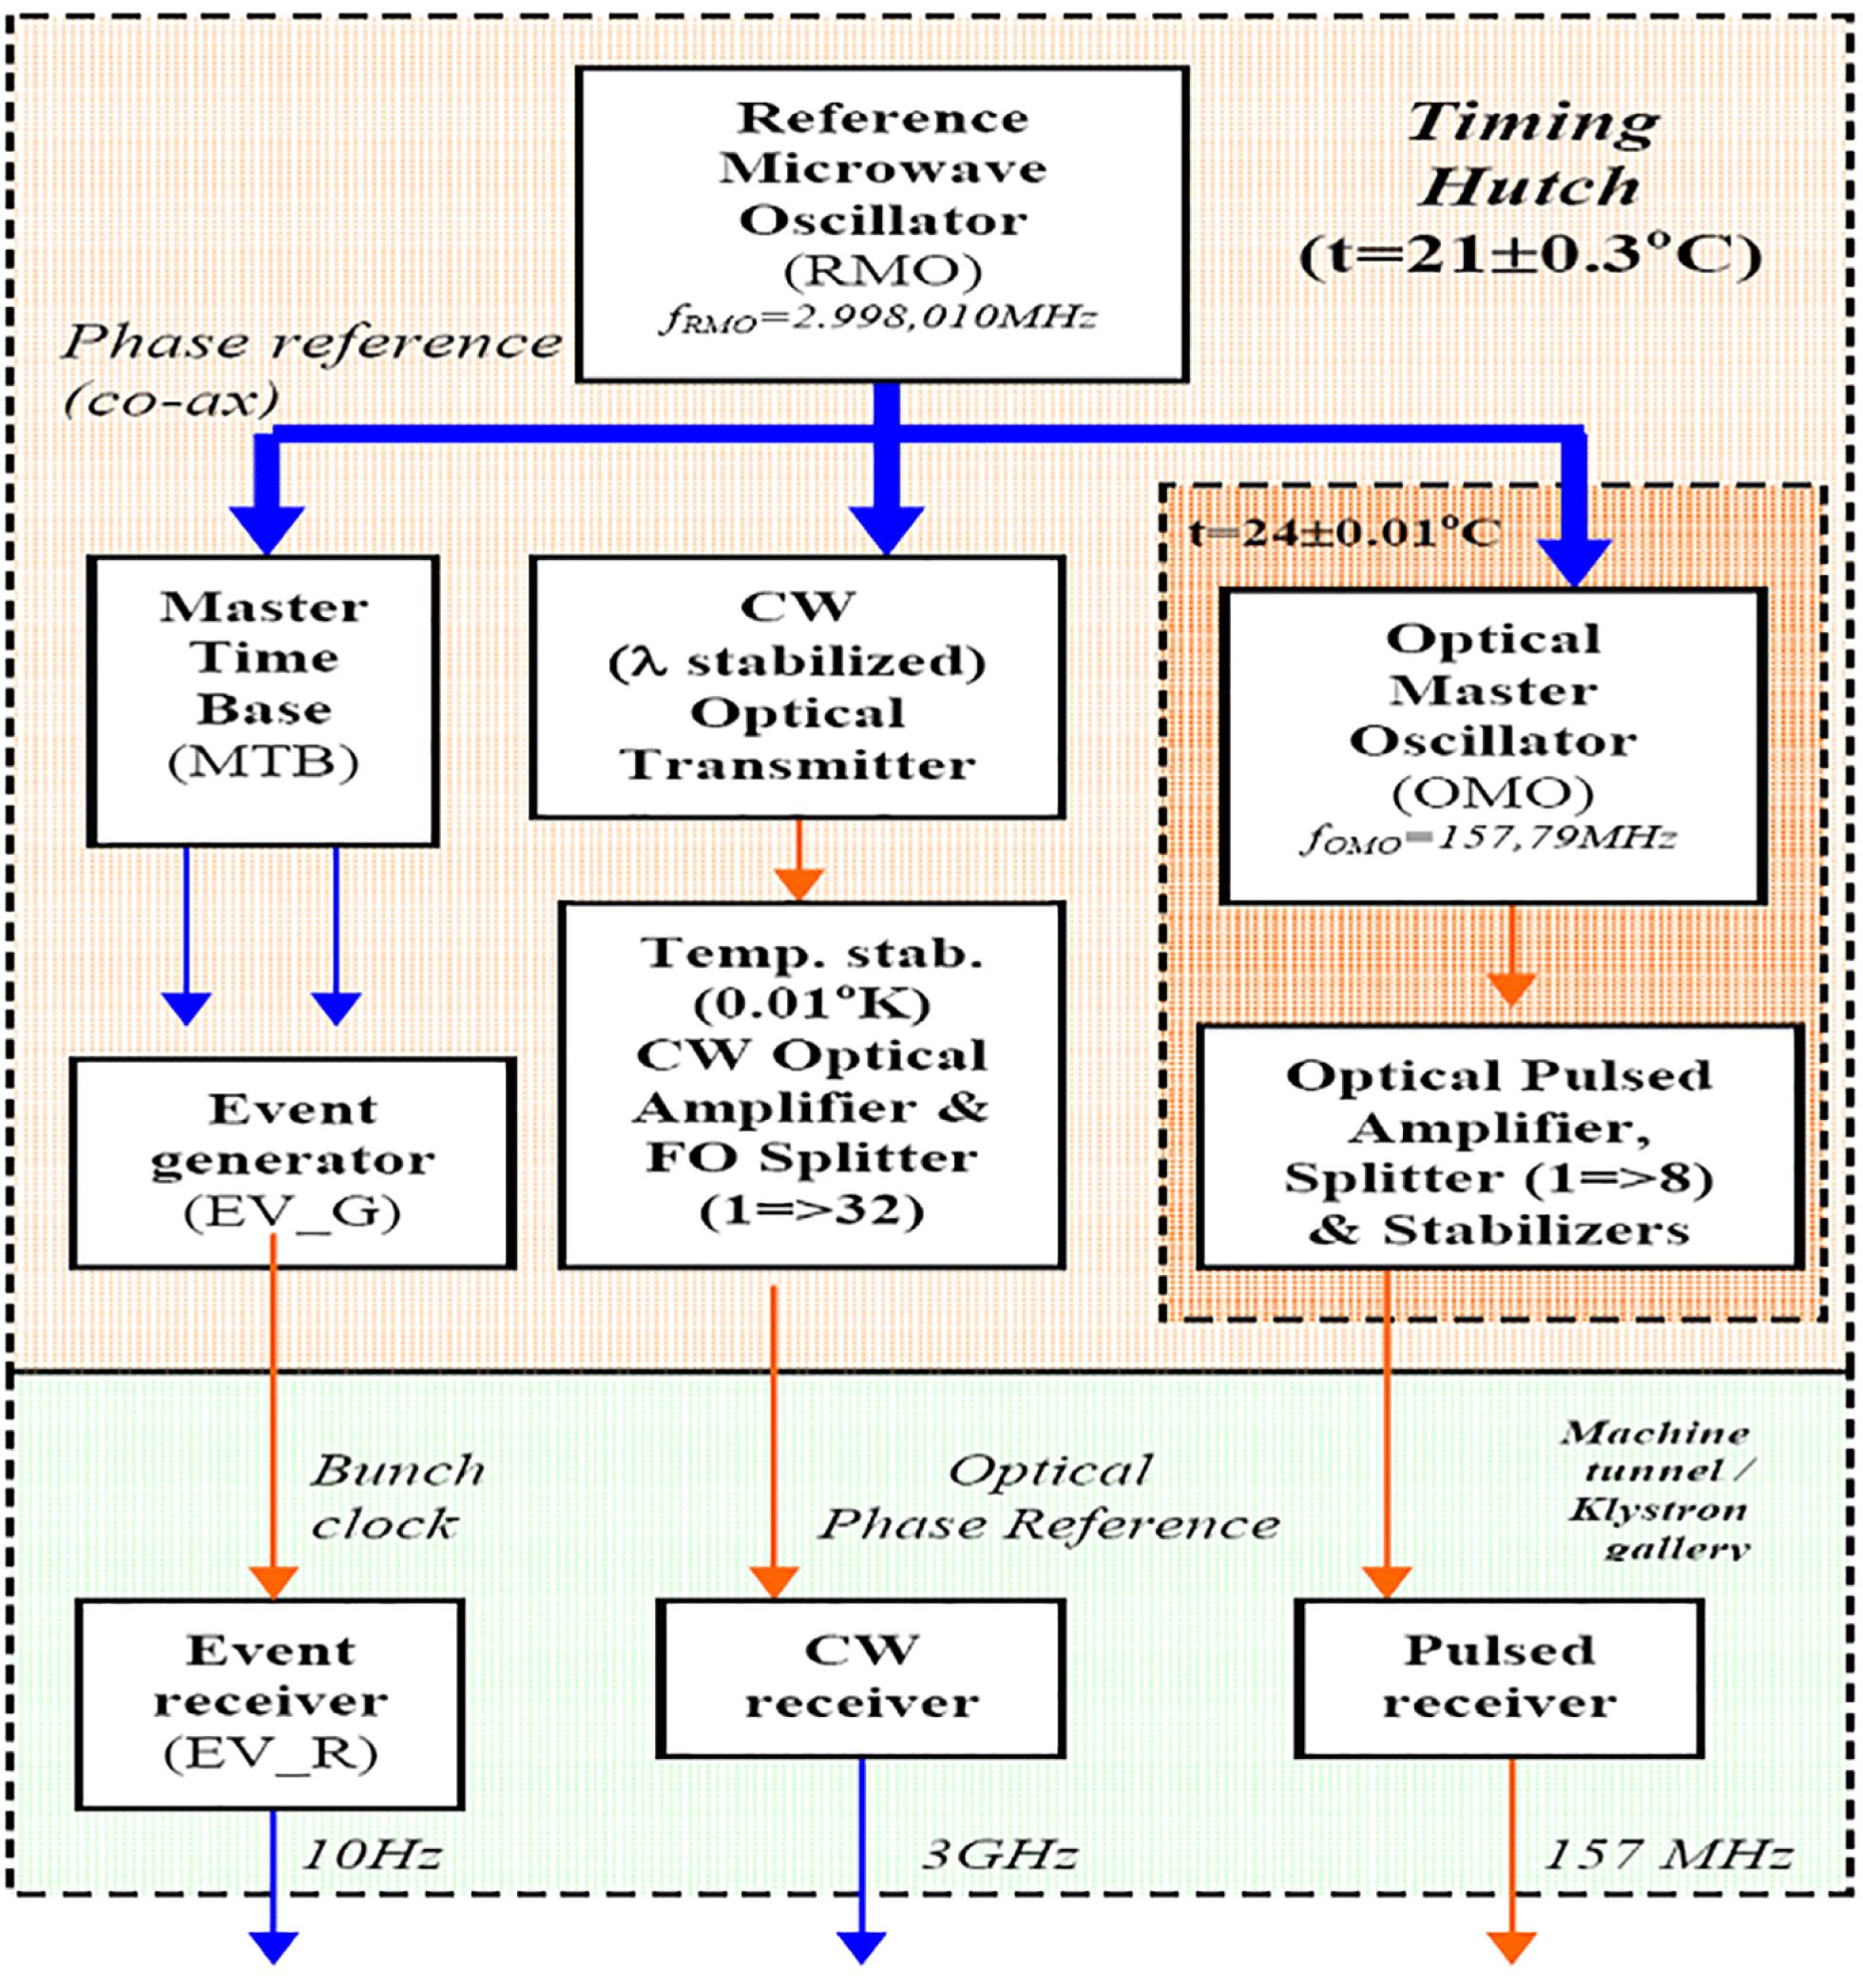
Fig. 1. Block diagram of the FERMI timing system.
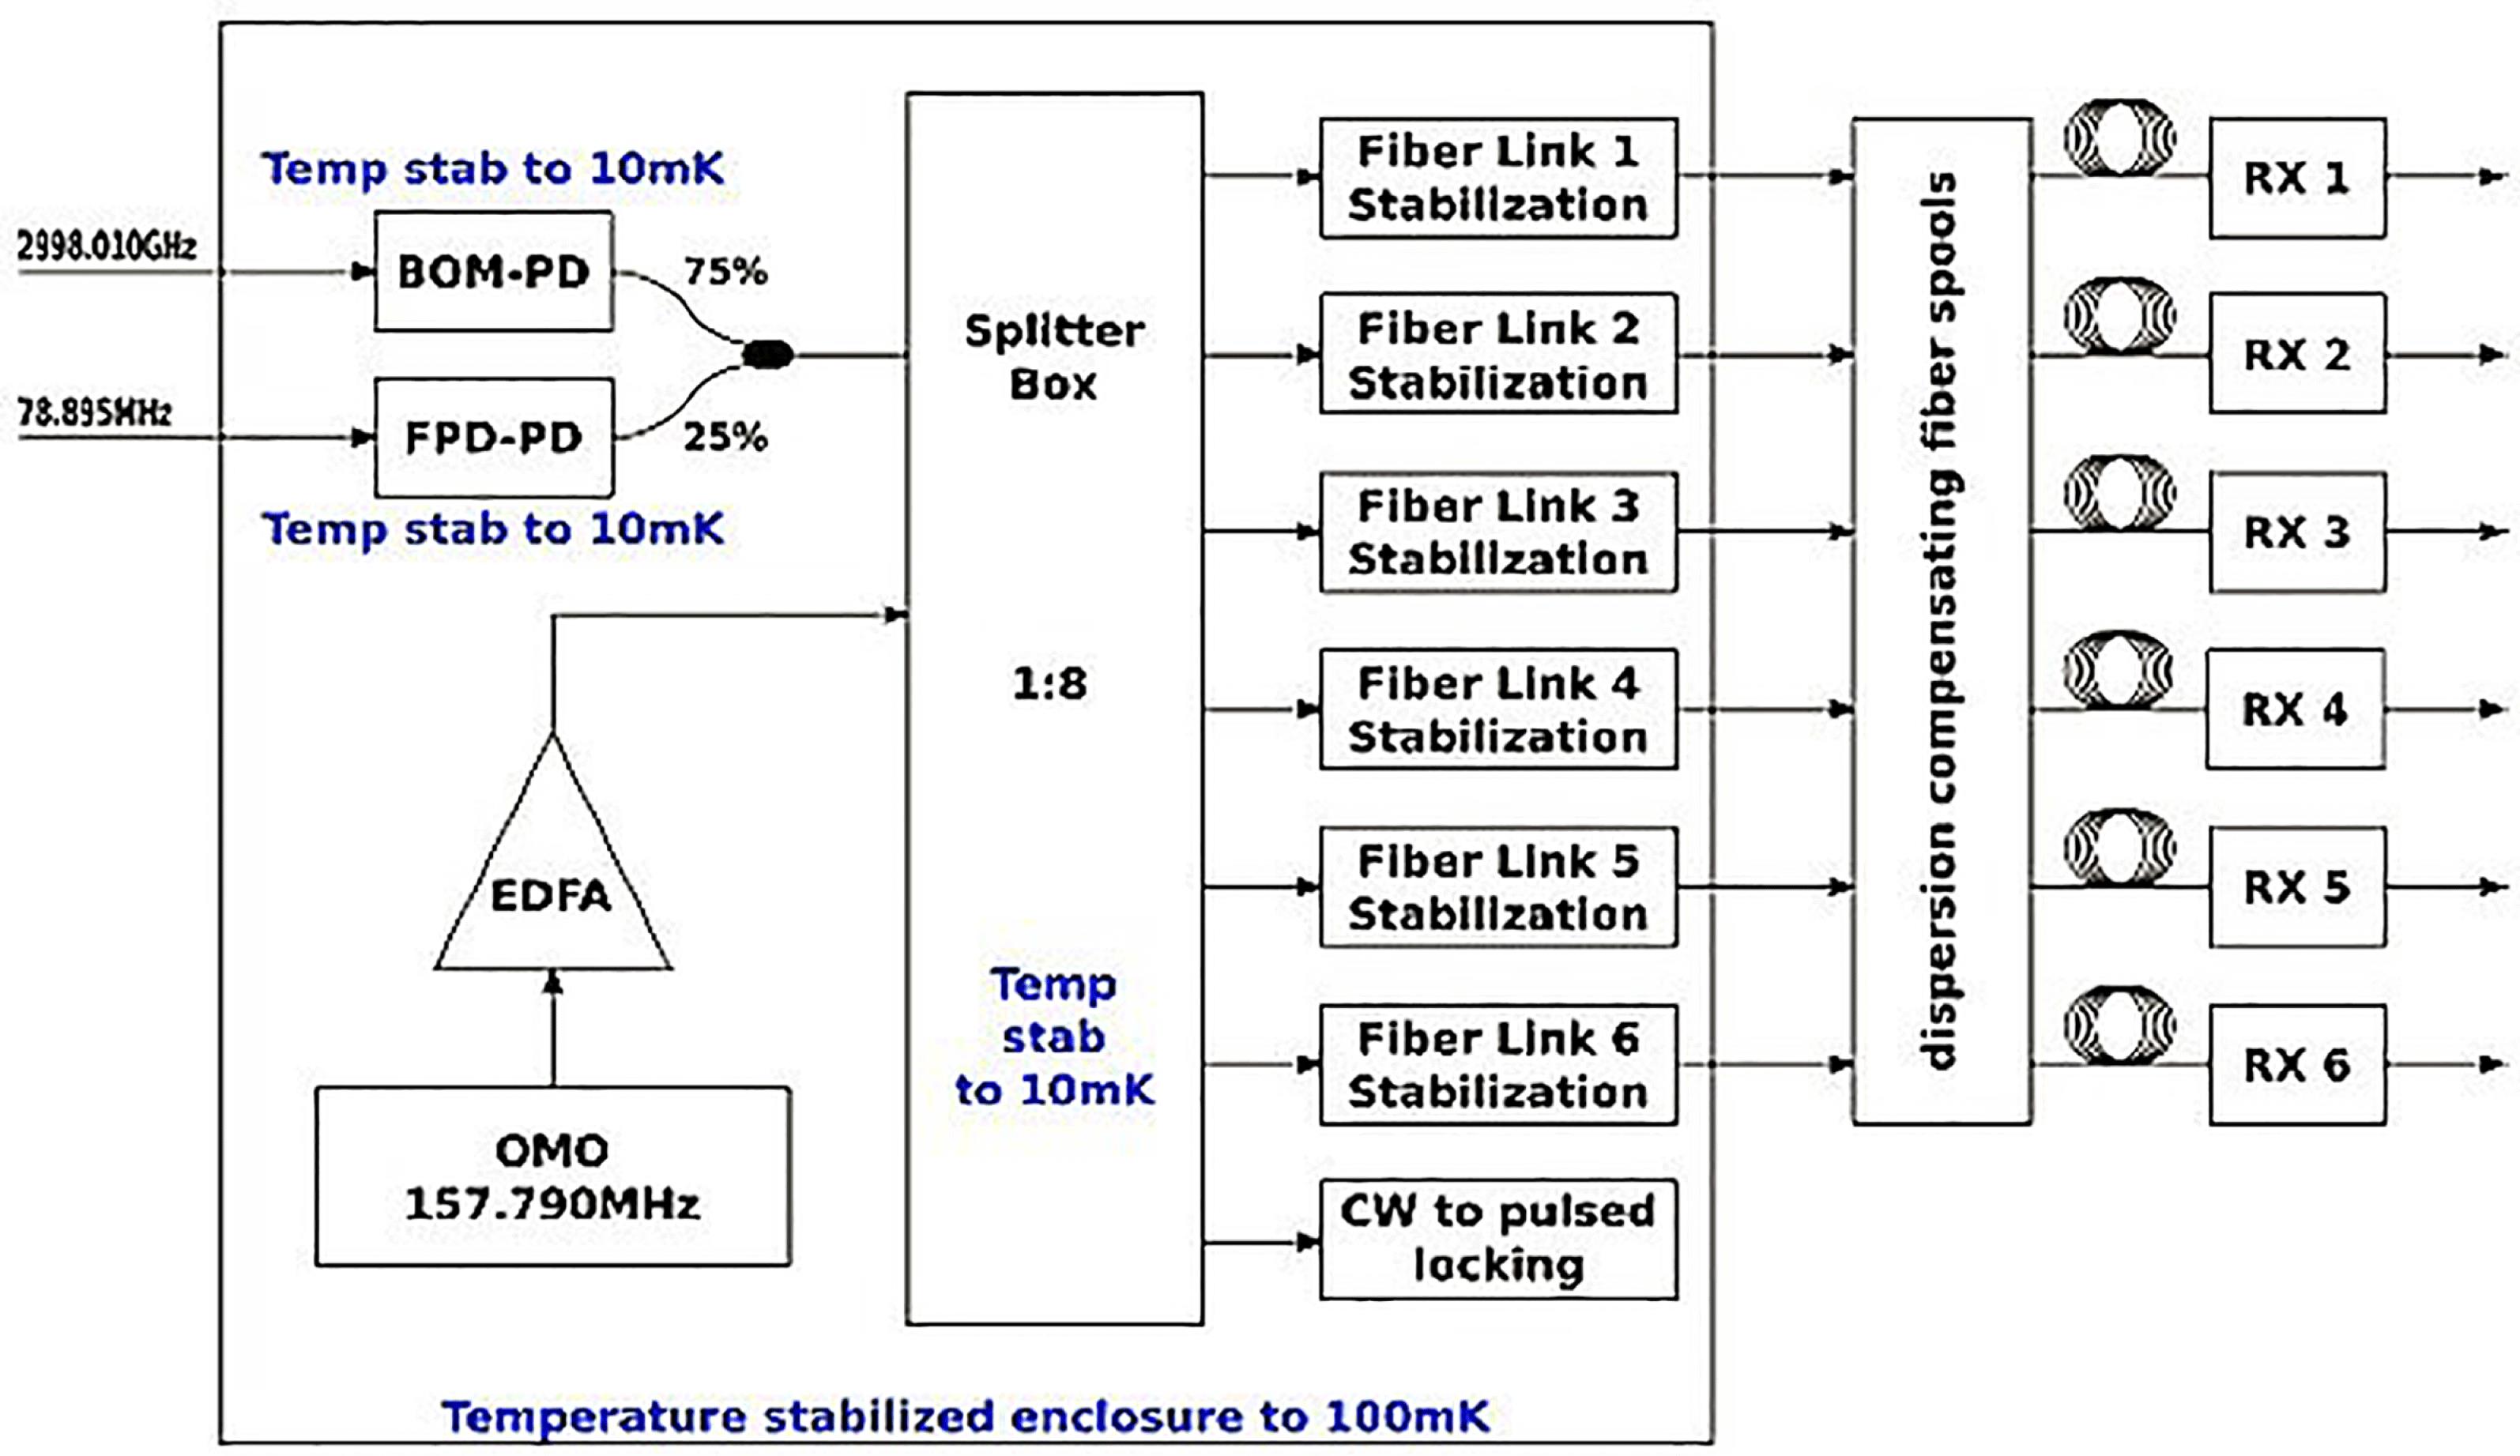
Fig. 2. Block diagram of the pulsed optical timing system.
Fig. 3. OOL stability measurement of a 150 m pulsed stabilized link (loopback mode). The residual relative drift between the link output and the local splitter port is equal to $5.3~\text{fs}_{\text{RMS}}$ .
Fig. 4. Acquisition showing the typical trend of the arrival time at the BAM station, installed after the first bunch compressor. The feedback based on the arrival time was not active.
Fig. 5. Layout of the BLM.
Fig. 6. Single electron spectral dependence of the radiation emitted from the fourth dipole of BC1; the edge radiation (blue) is dominated by the velocity term and the synchrotron radiation (green) is dominated by the acceleration term.
Fig. 7. Spectral dependence of the transmission of the optical system.
Fig. 8. Pyrodetector signal versus LINAC 1 RF phase.
Fig. 9. Schematic representation of the BAM[34].
Fig. 10. Block diagram of the BAM front end.
Fig. 11. Block diagram of the BAM back end.
Fig. 12. Estimation of the BAM resolution. By splitting in quadrature the contributions of two independent BAM stations, the width of the shot-to-shot correlations shows an upper estimation for the resolution in 8 fs RMS (bunch charge $=$ 500 pC).
Fig. 13. Layout of FERMI longitudinal feedbacks.
Fig. 14. Spectra of the two BAMs with BC1 BAM feedback, OFF and ON.
Fig. 15. Spectra of the bunch arrival (top) and energy (bottom) sensor feedbacks, with bunch arrival feedback configured with low or high loop gain.
Fig. 16. Spectra of the BC1 compression factor (top) and the FEL output power (bottom) when compression feedback is switched OFF and ON.
Fig. 17. 700 pC-bunch longitudinal phase space imaged on a YAG screen placed in the energy spectrometer at the end of the LINAC; the head of the bunch is on the left.
Fig. 18. Time-sliced current (red line) and energy spread (blue line) along the bunch obtained from the longitudinal phase space reported in Figure 6.1, relative to a 700 pC bunch. The head of the bunch is on the left.

Set citation alerts for the article
Please enter your email address
© Copyright 2018-2021 | Chinese Laser Press. All Rights Reserved 沪ICP备15018463号-20