
Qiang Wen, Jiying Li, Yonghong Yang, Lei Wang. LTE-R Handover Algorithm Based on Grey Prediction[J]. Laser & Optoelectronics Progress, 2020, 57(19): 190601
- Laser & Optoelectronics Progress
- Vol. 57, Issue 19, 190601 (2020)
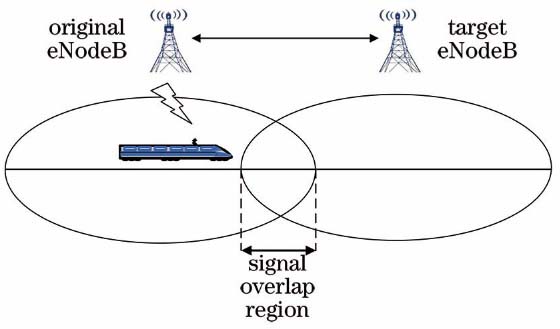
Fig. 1. Diagram of handover model
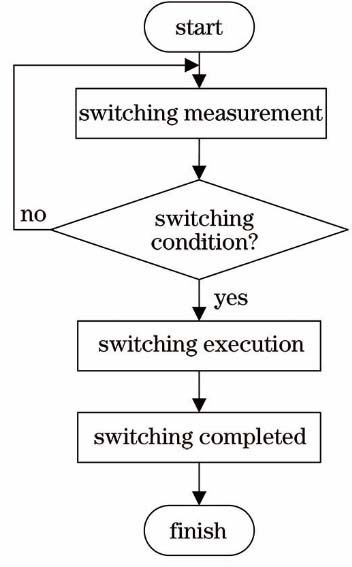
Fig. 2. Chart of handover
Fig. 3. Diagram of measurement filtering process
Fig. 4. Diagram of measurement period Tm and reporting period Tu
Fig. 5. Fitting effect of concave variation sequence
Fig. 6. Fitting effect of convex variation sequence
Fig. 7. Fitting effect of monotonic augmentation sequence
Fig. 8. Fitting effect of monotonic subtraction sequence
Fig. 9. Flowchart of improved algorithm
Fig. 10. RSRP of traditional A3 algorithm
Fig. 11. RSRP of improved algorithm
Fig. 12. Comparison of occurrence times of ping-pong switching of three algorithms
Fig. 13. Comparison of ping-pong switching trigger rates of various algorithms
Fig. 14. Comparison of switching success rates of three algorithms
|
Table 1. Simulation configuration table

Set citation alerts for the article
Please enter your email address
© Copyright 2018-2021 | Chinese Laser Press. All Rights Reserved 沪ICP备15018463号-20