
Hao Tang, Dong Li, Cheng Wang, Sheng Nie, Jiayin Liu, Ye Duan. Global Registration Method for Laser SLAM Point Clouds Based on Graph Optimization[J]. Laser & Optoelectronics Progress, 2024, 61(10): 1015003
- Laser & Optoelectronics Progress
- Vol. 61, Issue 10, 1015003 (2024)
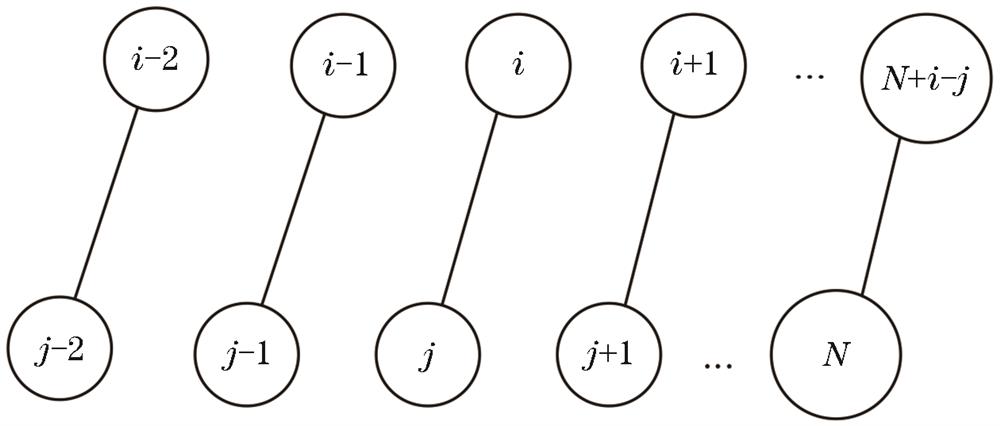
Fig. 1. Loop closure edges in the pose graph

Fig. 2. Global registration flow chart
Fig. 3. FAST-LIO 2 algorithm result of Data 1
Fig. 4. FAST-LIO 2 algorithm result of Data 2
Fig. 5. FAST-LIO 2 algorithm result of Data 3
Fig. 6. FAST-LIO 2 algorithm result of Data 4
Fig. 7. Comparison of point clouds before and after trajectory drift error optimization for Data 1 and Data 2
Fig. 8. Comparison of point clouds before and after trajectory drift error optimization for Data 3 and Data 4
Fig. 9. Scene comparison of Data 1 before and after optimization
Fig. 10. Scene comparison of Data 2 before and after optimization
Fig. 11. Scene comparison of Data 3 before and after optimization
Fig. 12. Scene comparison of Data 4 before and after optimization
|
Table 1. Description of input data
|
Table 2. Description of experimental results
|
Table 3. Average value of the distance RMSE of the matching point pairs

Set citation alerts for the article
Please enter your email address
© Copyright 2018-2021 | Chinese Laser Press. All Rights Reserved 沪ICP备15018463号-20