
Qiang Wu, Rui Zhang. Wavelet Denoising of Near-Earth All-Day Star Map Based on Local Outlier Factor[J]. Acta Optica Sinica, 2020, 40(8): 0810001
- Acta Optica Sinica
- Vol. 40, Issue 8, 0810001 (2020)
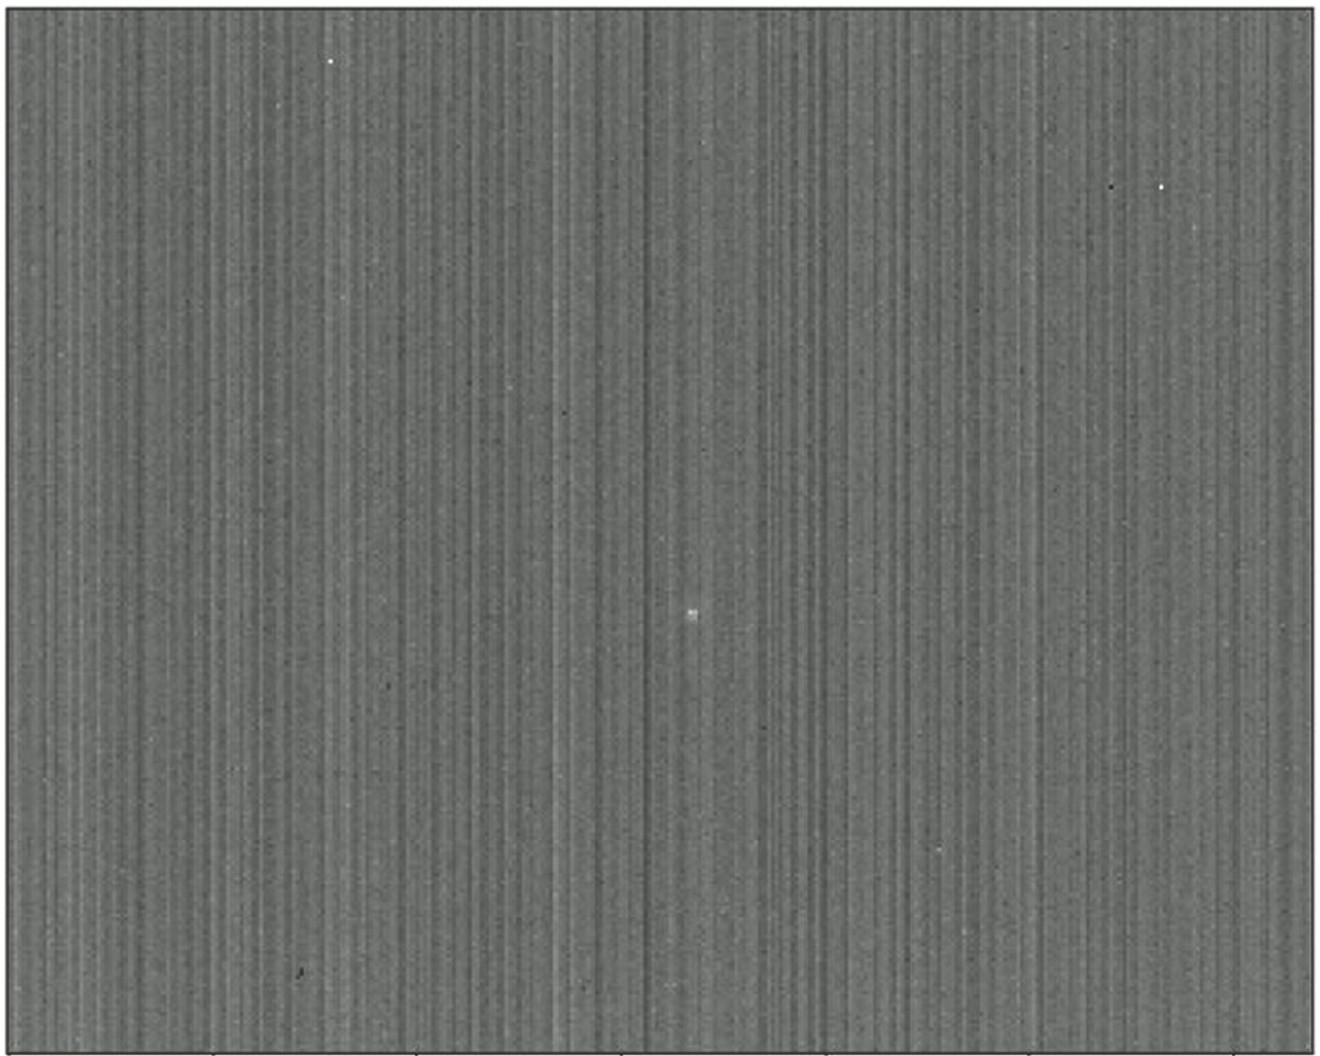
Fig. 1. Real star map
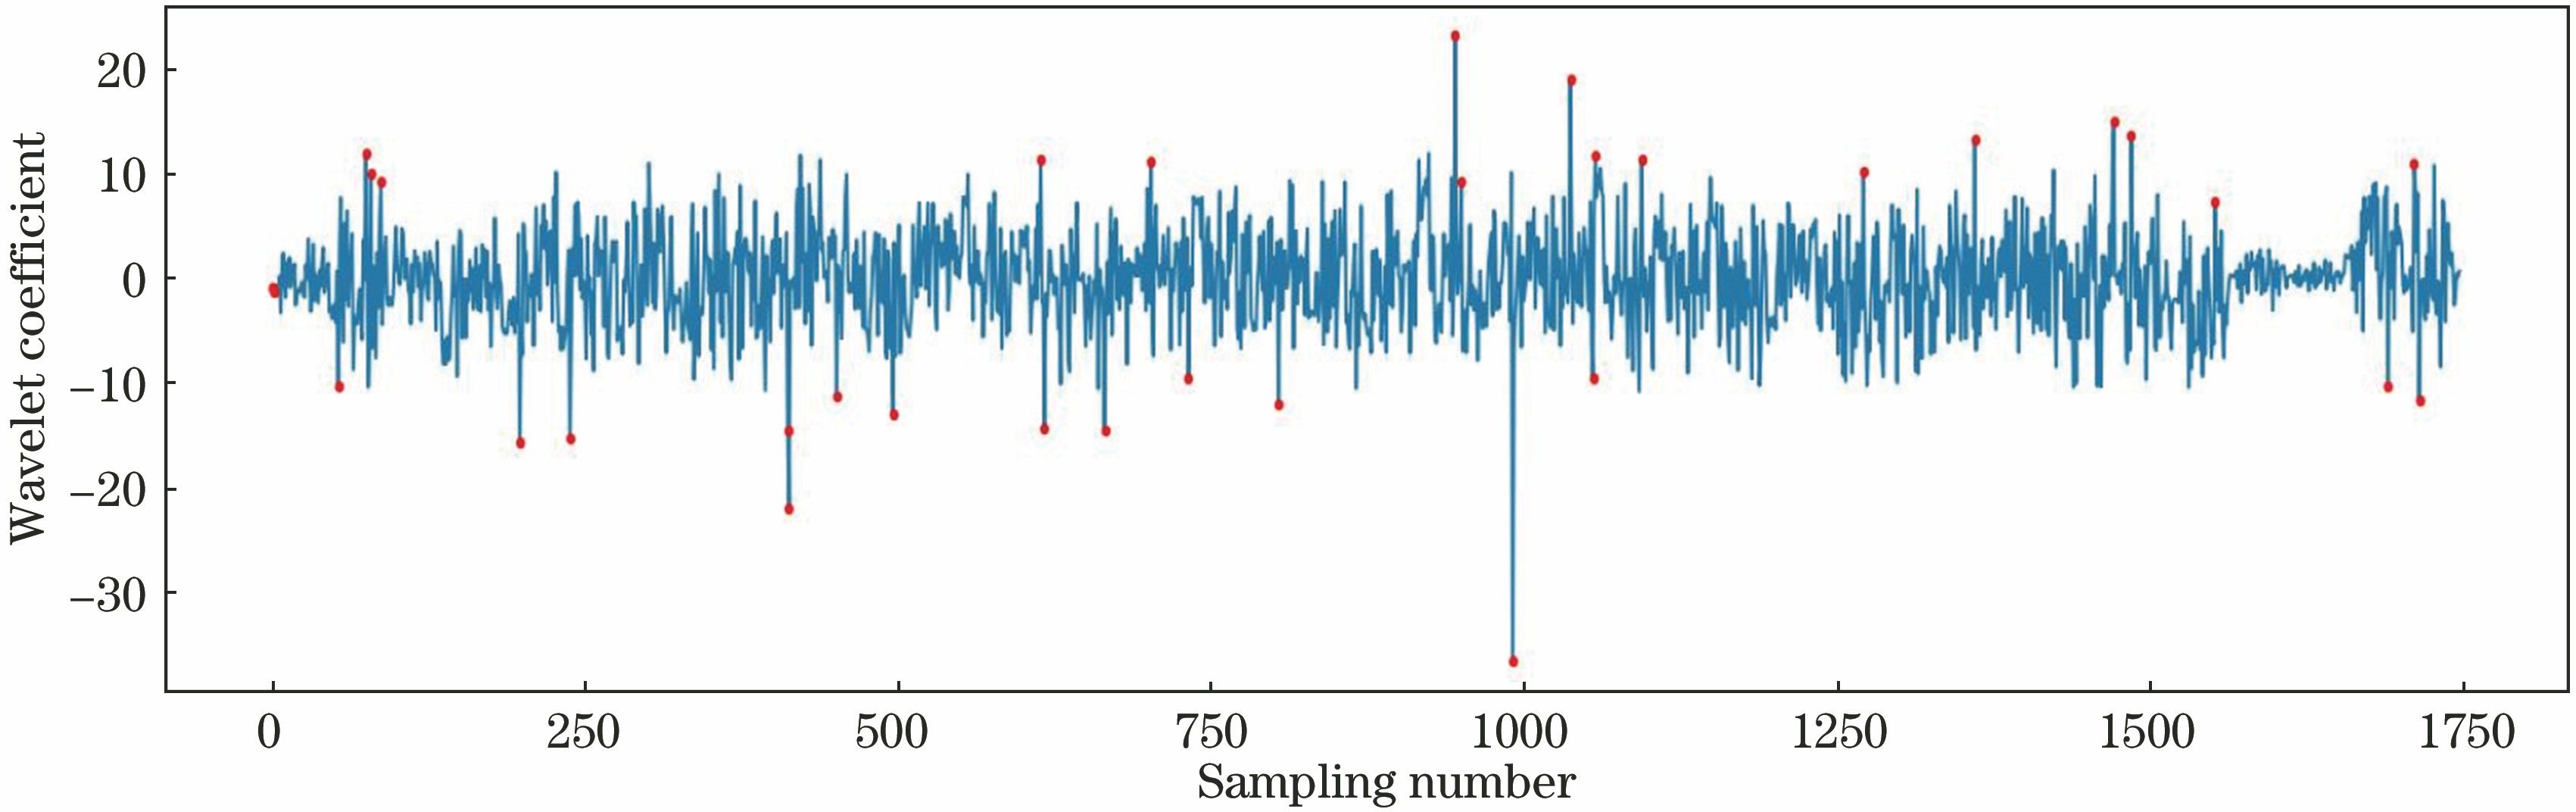
Fig. 2. Horizontal high frequency coefficient in third level after 2D wavelet transform to Fig. 1
Fig. 3. High frequency and low frequency coefficients after 2D wavelet transform to the experimental star map. (a) Horizontal high frequency coefficient; (b) vertical high frequency coefficient; (c) diagonal high frequency coefficient; (d) low frequency coefficient
Fig. 4. High frequency and low frequency coefficients obtained by fitting and subtracting. (a) Horizontal high frequency coefficient; (b) vertical high frequency coefficient; (c) diagonal high frequency coefficient; (d) low frequency coefficient
Fig. 5. Real local star map
Fig. 6. 3D energy of star map
Fig. 7. Star map processed by actual star sensor
Fig. 8. Denoised effect map after NL-means denoising
Fig. 9. Denoised effect map after WTD denoising
Fig. 10. Denoised effect map after LOF-WTD denoising
Fig. 11. 3D figure with NL-means
Fig. 12. 3D figure with WTD
Fig. 13. 3D figure with LOF-WTD
|
Table 1. Result data of each denoising method of star map

Set citation alerts for the article
Please enter your email address
© Copyright 2018-2021 | Chinese Laser Press. All Rights Reserved 沪ICP备15018463号-20