Author Affiliations
1East China Normal University, State Key Laboratory of Precision Spectroscopy, Joint Institute of Advanced Science and Technology, School of Physics and Electronic Science, Shanghai, China2CAS Center for Excellence in Ultra-intense Laser Science, Shanghai, China3Shanxi University, Collaborative Innovation Center of Extreme Optics, Taiyuan, Chinashow less
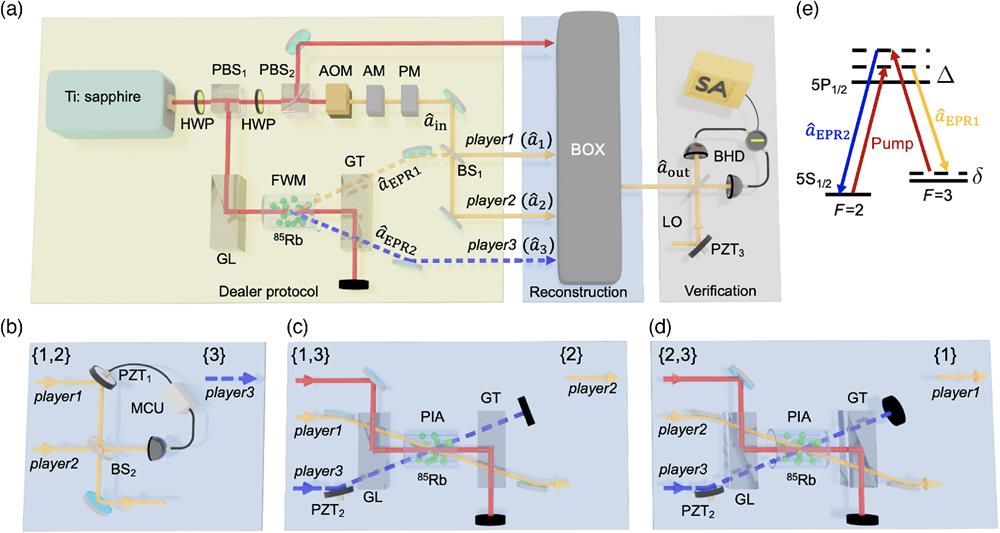
Fig. 1. The detailed experimental setup of the deterministic AOQSS protocol. (a) The detailed experimental scheme. (b) reconstruction structure. (c) reconstruction structure. (d) reconstruction structure. HWP, half-wave plate; GL, Glan–laser polarizer; GT, Glan–Thompson polarizer; , the annihilation operator associated with the secret coherent state; , , and , the annihilation operators associated with three shares held by player1, player2, and player3, respectively. (e) Energy level diagram of the double- scheme in the line of . , one-photon detuning; , two-photon detuning.
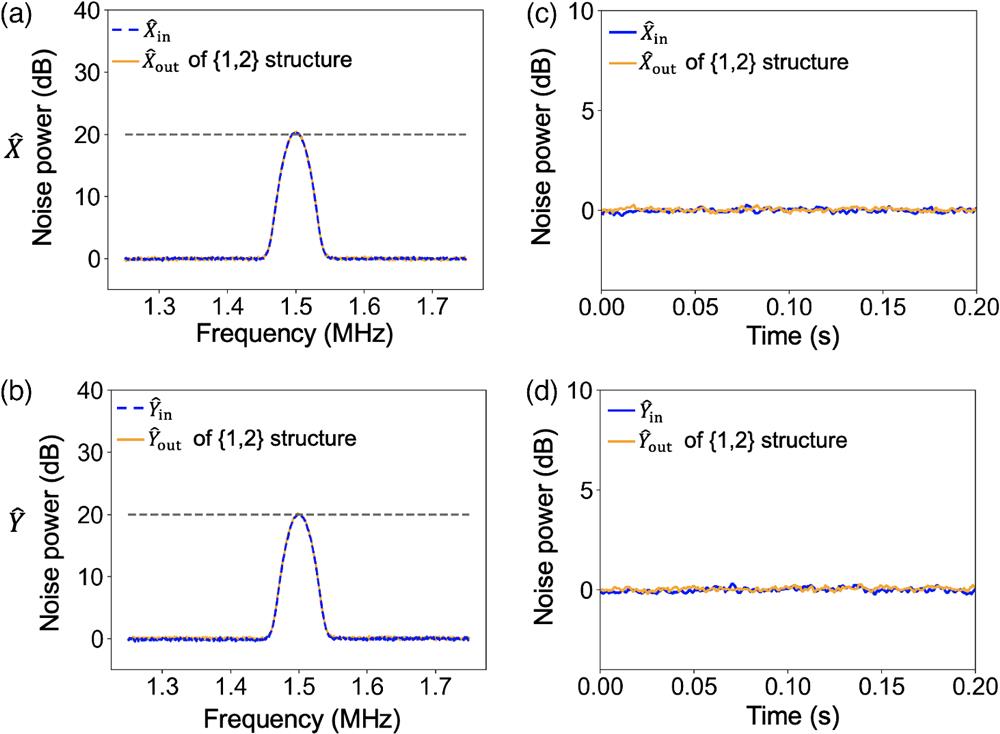
Fig. 2. The typical noise power results for reconstruction structure. (a) and (b) The amplitude and phase quadrature variances with classical modulations for the input secret state (blue dashed traces) and the output state (orange solid traces), respectively. (c) and (d) The amplitude and phase quadrature variances without classical modulations for the input secret state (blue traces) and the output state (orange traces) at 1.5 MHz, respectively. The vertical scale is normalized to the quadrature variances of the input secret state.
Fig. 3. The typical noise power results for reconstruction structure and the corresponding adversary structure . (a) and (b) The amplitude and phase quadrature variances with classical modulations for the input secret state (blue dashed traces) and the output state (orange solid traces) of the classical structure, respectively. (c) and (d) The amplitude and phase quadrature variances without the classical modulations for the input secret state (blue traces), the output state of structure (green traces), and the corresponding classical structure (orange traces), respectively. The center frequency of SA is set to 1.5 MHz. (e) and (f) The amplitude and phase quadrature variances of structure, respectively. The input secret state and the output state with (without) classical modulations are shown as the blue (black) traces and the orange (red) traces, respectively. The vertical scale is normalized to the quadrature variances of the input secret state.
Fig. 4. The experimental fidelities versus the sideband frequency. The fidelities of deterministic AOQSS with a reconstruction structure and corresponding experimental classical limit are shown as the blue trace and the orange trace, respectively. The error bars are obtained from the standard deviations of multiple repeated measurements.