
Li-li YANG, Zhen-peng WANG, Cai-cong WU. Research on Large-Scale Monitoring of Spider Mite Infestation in Xinjiang Cotton Field Based on Multi-Source Data[J]. Spectroscopy and Spectral Analysis, 2021, 41(12): 3949
- Spectroscopy and Spectral Analysis
- Vol. 41, Issue 12, 3949 (2021)
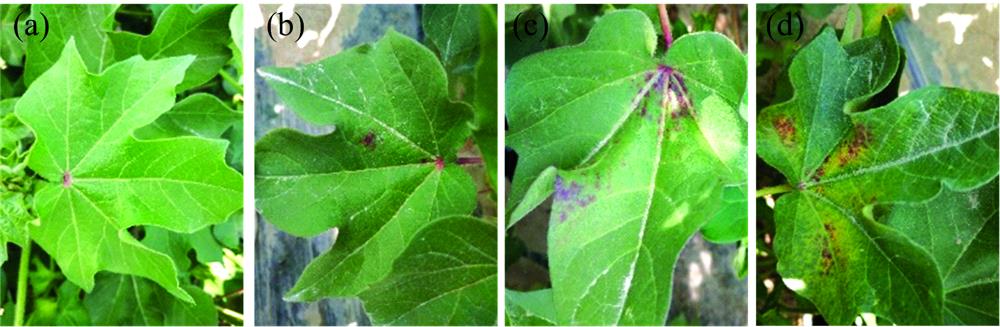
Fig. 1. Images of cotton leaves with different degree of mite damage
(a): Level 0; (b): Level 1; (c): Level 2; (d): Level 3
(a): Level 0; (b): Level 1; (c): Level 2; (d): Level 3
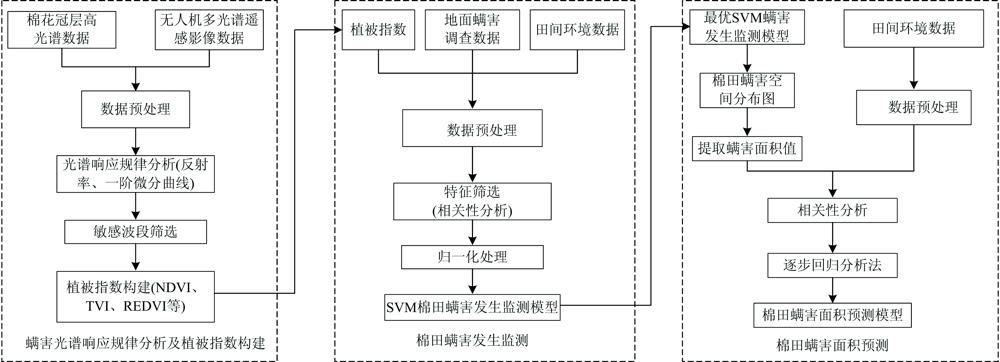
Fig. 2. Technical route of cotton field spider mite monitoring
Fig. 3. Spectral reflectance curves of ground canopies with different degrees of mite damage
Fig. 4. First derivative spectral curve of ground canopy with the different degrees of spider mites damage
Fig. 5. Reflectance curve of multispectral image with different degrees of spidermite damage
Fig. 6. Spatial distribution map (a, b, c, d, e, f) of cotton field spider mite monitoring in (June 22, 27, 28, Jule 3, 9, 13) different periods
|
Table 1. Calculation formulas for vegetation index
|
Table 2. Correlation between the occurrence of spider mite and vegetation indices
|
Table 3. Correlation between the occurrence of spider mite and environmental data
| |||||||||||||||||||||||||||||||||||||||||||||||||||||
Table 4. Comparison of classification results of the different degrees of spider mite monitoring models
|
Table 5. Correlation coefficient between environmental data and cotton field spider mite area
|
Table 6. Model evaluation results
|
Table 7. Comparison of prediction results of cotton field spider mite area prediction models

Set citation alerts for the article
Please enter your email address
© Copyright 2018-2021 | Chinese Laser Press. All Rights Reserved 沪ICP备15018463号-20