
Wang-jun JIN, Yan LI, Yue ZHAO, Sheng-hua MEI. In Situ Raman Study and Kinetic Analysis of Hydrothermal Liquefaction of Glycine[J]. Spectroscopy and Spectral Analysis, 2022, 42(11): 3448
- Spectroscopy and Spectral Analysis
- Vol. 42, Issue 11, 3448 (2022)
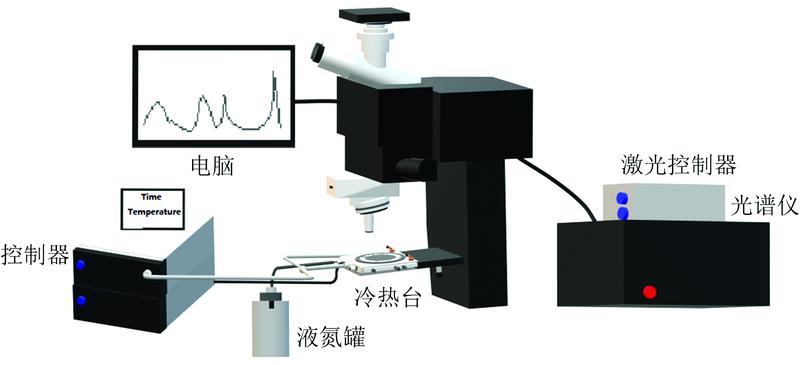
Fig. 1. Schematic diagram of Raman spectrum analysis system
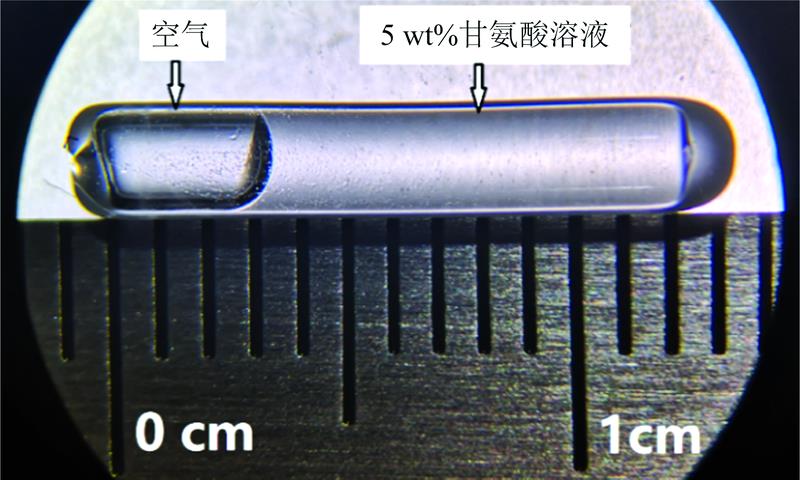
Fig. 2. An image of a sample (5 Wt% glycine solution) sealed in fused silica capillary reactor
Fig. 3. Raman spectrum of 5 Wt% glycine aqueous solution at room temperature
Fig. 4. The characteristic Raman peak of glycine, ν (C—C), changes with time at different temperatures
(a): 270 ℃; (b): 280 ℃; (c): 290 ℃
(a): 270 ℃; (b): 280 ℃; (c): 290 ℃
Fig. 5. The characteristic Raman peak of glycine, ν (C—N), changes with time at different temperatures
(a): 270 ℃; (b): 280 ℃; (c): 290 ℃
(a): 270 ℃; (b): 280 ℃; (c): 290 ℃
Fig. 6. The characteristic Raman peak of glycine, ν as(COO-), changes with time at different temperatures
(a): 270 ℃; (b): 280 ℃; (c): 290 ℃
(a): 270 ℃; (b): 280 ℃; (c): 290 ℃
Fig. 7. The intensity of characteristic Raman peaks of glycine change with time
(a):ν (C—C); (b): ν (C—N); (c): ν as(COO-)
(a):
Fig. 8. Raman spectra of 5 Wt% glycine aqueous solution before and after reaction
a : The spectrum of glycine solution at room temperature before reaction; b —d : The spectra of reactant after reaction at different temperatures: b : 270 ℃, c : 280 ℃, d : 290 ℃
Fig. 9. ln(I 0/It )~t fitting curve of C—C stretching Raman peak at different temperatures. The quadratic coefficient is denoted the rate for its hydrothermal liquefaction
Fig. 10. lnk- 1/RT fitting curve of C—C stretching Raman peak. The slope of the curve is the activation energy for its hydrothermal liquefaction
|
Table 1. Fitting reaction constants of ν (C—C) at different temperatures

Set citation alerts for the article
Please enter your email address
© Copyright 2018-2021 | Chinese Laser Press. All Rights Reserved 沪ICP备15018463号-20