
Jinyong Zhang, Zongneng Xie, Ping Kong, Yue Li. Application of Speckle Perfusion Imaging in Medicine[J]. Laser & Optoelectronics Progress, 2022, 59(22): 2200003
- Laser & Optoelectronics Progress
- Vol. 59, Issue 22, 2200003 (2022)
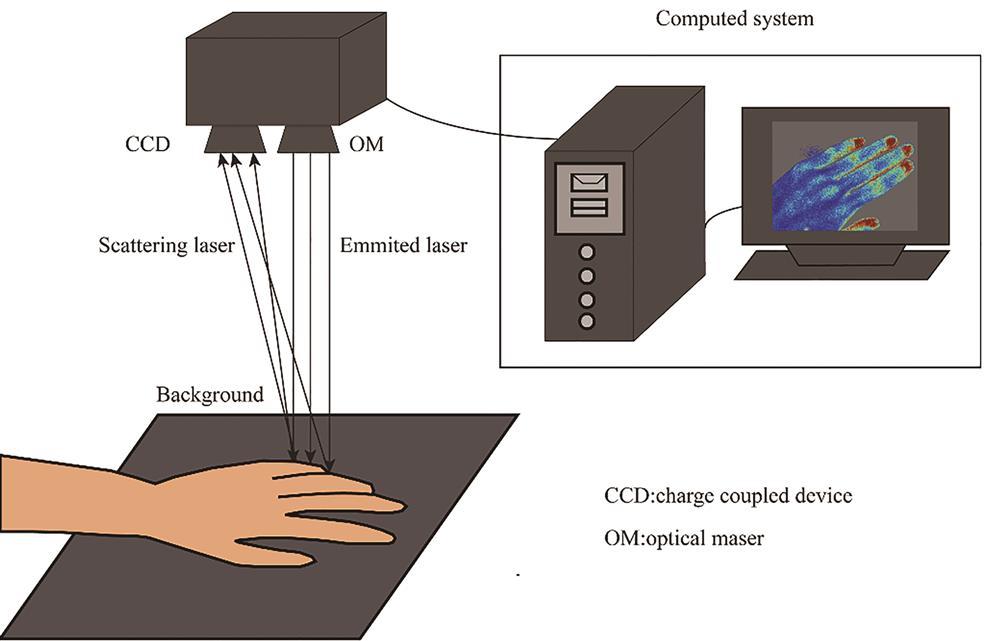
Fig. 1. SFPI equipment
![SFPI algorithms. (a) Spatial contrast analysis[7]; (b) time contrast analysis[8]; (c) spatial-temporal contrast analysis[9]](/richHtml/lop/2022/59/22/2200003/img_02.jpg)
Fig. 2. SFPI algorithms. (a) Spatial contrast analysis[7]; (b) time contrast analysis[8]; (c) spatial-temporal contrast analysis[9]
Fig. 3. Effects of hypercapnia, hyperxemia, and light stimulation on retinal blood perfusion in rats monitored by SFPI [38]. (a) Increased retinal blood perfusion due to hypercapnia; (b) decreased retinal blood perfusion due to hyperxemia; (c) increased blood perfusion at corresponding sites of retina caused by light stimulation
Fig. 4. SFPI first used to monitor human retinal blood perfusion[6]. (a) Retinal vessels before high-pass filtering; (b) retinal vessels after high-pass filtering
Fig. 5. SFPI used to monitor the changes of blood perfusion at the beginning of middle cerebral artery occlusion and 20 min after occlusion in rats. (a) Distribution of cerebral blood flow at onset of cerebral artery occlusion; (b) distribution of cerebral blood flow 20 min after cerebral artery occlusion[43]
Fig. 6. SFPI used to monitor changes of cerebral blood perfusion in intraoperative middle cerebral artery occlusion[54]. (a) Pre-blocking (baseline); (b) blocked; (c) after bypass open
Fig. 7. SFPI used to monitor change of skin blood perfusion within 15 days after scald in children[60]. (a) 14 hours after scald; (b) 4 days after scald; (c) 6 days after scald; (d) 8 days after scald; (e) 15 days after scald
Fig. 8. SFPI used to monitor influence of different courses of systemic sclerosis on palm perfusion[62]. (a) Normal palmar blood perfusion; (b) blood perfusion in early systemic sclerosis; (c) blood perfusion in metaphase systemic sclerosis; (d) blood perfusion in advanced systemic sclerosis
Fig. 9. SFPI used to monitor effect of moxibustion on blood perfusion of hand back and palm[70]. (a) Speckle flow perfusion image of back of hand corresponding to meridian before, during, and after moxibustion at Waiguan point; (b) speckle flow perfusion image of back of hand corresponding to meridian before, during, and after moxibustion at Neiguan point
Fig. 10. SFPI used to monitor changes of vascular density during glioma development in rats[77]. (a) Cerabral vascular density of normal rats at day 0, 7, and 14 in control group; (b) cerebral vascular density of glioma group at day 0, 7, and 14 in experiment group
Fig. 11. SFPI used to measure changes of neovascular perfusion during the development of CAMs tumor in chick embryo[80]. (a) CAM blood perfusion image of cell transplanted tumor (8 days after embryo development, tumor transplanted); (b) CAM perfusion image of cell transplanted tumor (tumor observed on day 16 of chick embryo development); (c) CAM blood perfusion image of tumor mass implantation (tumor implantation began on day 8 of chick embryo development); (d) CAM perfusion image of tumor graft (observation of tumor on day 16 of chick embryo development)

Set citation alerts for the article
Please enter your email address
© Copyright 2018-2021 | Chinese Laser Press. All Rights Reserved 沪ICP备15018463号-20