
Peng Wang, Chen Zhang, Shaoen Jiang, Xiaoxi Duan, Huan Zhang, LiLing Li, Weiming Yang, Yonggang Liu, Yulong Li, Liang Sun, Hao Liu, Zhebin Wang. Density-dependent shock Hugoniot of polycrystalline diamond at pressures relevant to ICF[J]. Matter and Radiation at Extremes, 2021, 6(3): 035902
- Matter and Radiation at Extremes
- Vol. 6, Issue 3, 035902 (2021)
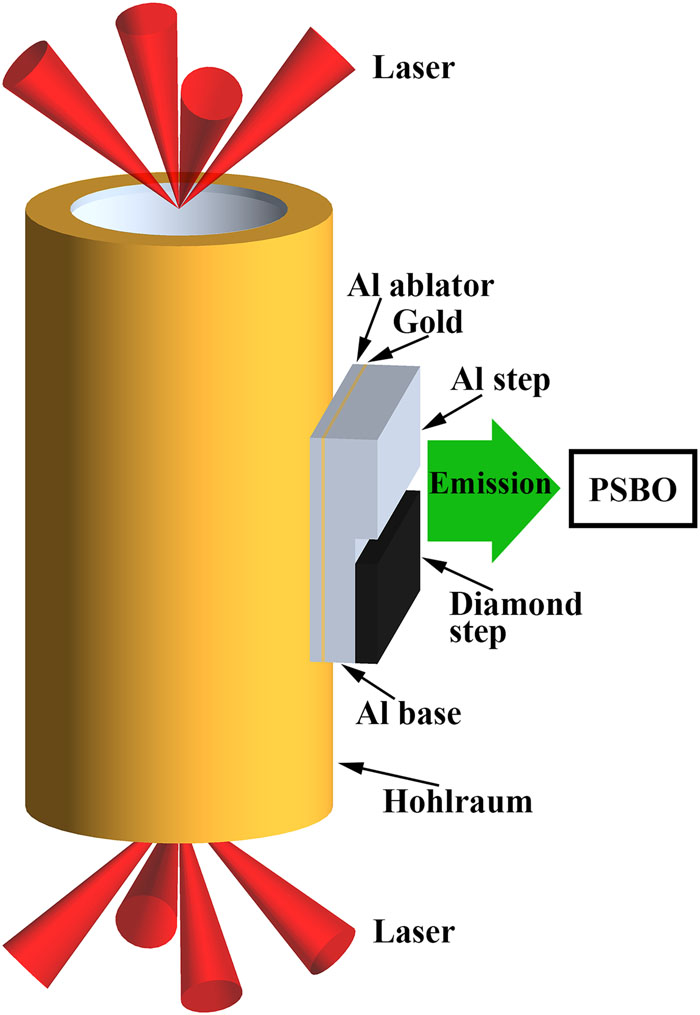
Fig. 1. Schematic of experimental configuration with impedance-matching target: PSBO, a passive shock breakout diagnostic system.
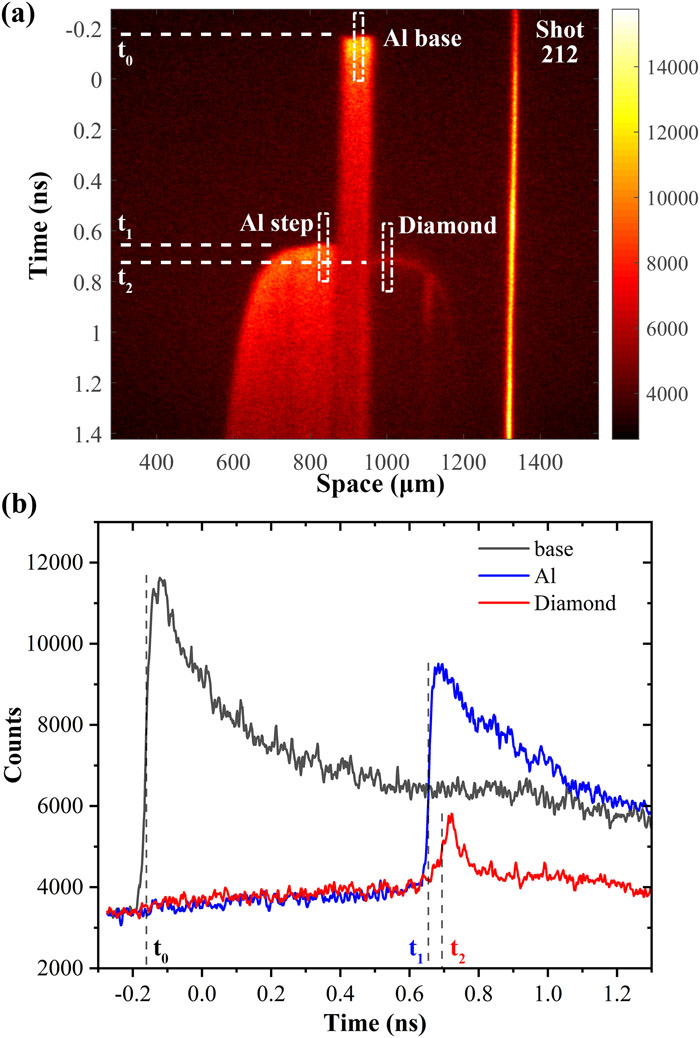
Fig. 2. (a) Streaked image of shot 212 recorded by a passive shock breakout diagnostic system (PSBO); the rightmost streak is stray light. (b) Average intensities of groups indicated in (a).
Fig. 3. (a) Shock wave propagation in standard and sample. (b) Impedance-matching analysis. Point A (u pA, P A) is the incident shock state in the standard, and point B (u pB, P B) is the Hugoniot state of the sample.
Fig. 4. Experimental data and fitted lines: (a) shock velocity vs particle velocity; (b) pressure vs density.
Fig. 5. Comparisons between Hugoniot data and models: (a) shock velocity vs particle velocity; (b) pressure vs density. The results of SESAME 7830 and SESAME 7831 are shown as the blue and green lines, respectively, for initial densities of 3.23, 3.36, and 3.515 g/cm3.
Fig. 6. Hugoniots of materials with diffeinitial density (ρ 0 = 3.515 g/cm3): (a) Hugoniots from SESAME 7830 and McQueen model in P –ρ plane; (b)–(d) Hugoniots from SESAME 7830, McQueen model, and Wu–Jing model in U s–u p plane.
Fig. 7. Grüneisen parameter vs density. The gray and yellow regions are the valid density regions for the Grüneisen parameter of the present work (red curve) and Gregor et al. 34 (black curve), respectively.
Fig. 8. (a) and (b) Grüneisen parameter calculated using Hugoniots of different initial density (full-density Hugoniot as reference) of SESAME 7830 and SESAME 7831; (c) and (d) Grüneisen parameter calculated along isochores of SESAME 7830 and SESAME 7831.
|
Table 1. Thicknesses of target steps used in experiments.
|
Table 2. Coefficients and uncertainties of piecewise-linear form of Us–up relationship Us = a0 + a1(up − β) for Al.41
|
Table 3. Experimental data of present study: subscripts 1 and 2 denote Al and diamond, respectively; Δ t, shock transition time in Al or diamond step; Us, measured average shock velocity; Us*, shock velocity with non-steady wave correction; up, particle velocity; P, pressure; ρ, density; Us1 and Us2* are used in impedance matching.

Set citation alerts for the article
Please enter your email address
© Copyright 2018-2021 | Chinese Laser Press. All Rights Reserved 沪ICP备15018463号-20