• Laser & Optoelectronics Progress
  • Vol. 58, Issue 12, 1217001 (2021)
Kang Xu1, Cheng Wang1、*, Mengjiao Zhang2, Qian Chen2、**, Huazhong Xiang1, and Gang Zheng1
Author Affiliations
  • 1Institute of Biomedical Optics and Optometry, School of Medical Instrument and Food Engineering, University of Shanghai for Science and Technology, Shanghai 200093, China
  • 2Institute of Acoustics, School of Physics and Engineering, Tongji University, Shanghai 200092, China
  • show less
    DOI: 10.3788/LOP202158.1217001 Cite this Article Set citation alerts
    Kang Xu, Cheng Wang, Mengjiao Zhang, Qian Chen, Huazhong Xiang, Gang Zheng. Photoacoustic Spectrum Analysis of Atherosclerotic Vessels[J]. Laser & Optoelectronics Progress, 2021, 58(12): 1217001 Copy Citation Text show less
    Schematic of photoacoustic spectrum analysis system
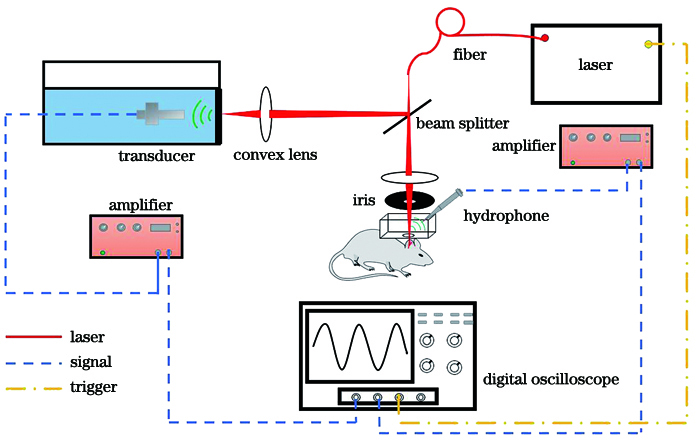
    Fig. 1. Schematic of photoacoustic spectrum analysis system
    Pictures of mouse ear. (a) Photograph of vessels in mouse ear; (b) optical microimaging of vessels at the bifurcation of mouse ear; (c) photoacoustic imaging of vessels at the root of mouse ear
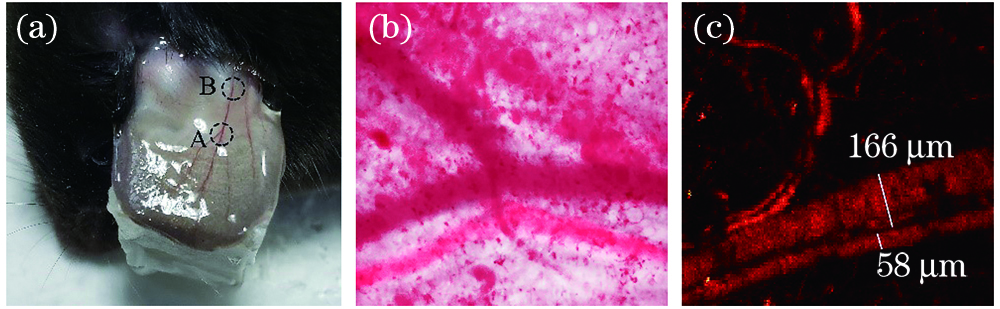
    Fig. 2. Pictures of mouse ear. (a) Photograph of vessels in mouse ear; (b) optical microimaging of vessels at the bifurcation of mouse ear; (c) photoacoustic imaging of vessels at the root of mouse ear
    Photoacoustic signal of vessel in mouse ear. (a) Time-domain signal; (b) power spectral density
    Fig. 3. Photoacoustic signal of vessel in mouse ear. (a) Time-domain signal; (b) power spectral density
    Simulation of vessel in mouse ear. (a) Simulation model; (b) log power spectrum
    Fig. 4. Simulation of vessel in mouse ear. (a) Simulation model; (b) log power spectrum
    Simulation data graphs. (a) Sound speed and slope; (b) sound speed and intercept
    Fig. 5. Simulation data graphs. (a) Sound speed and slope; (b) sound speed and intercept
    Slope and intercept scatter plots in 4th experiment. (a) (b) Position A; (c)(d) position B
    Fig. 6. Slope and intercept scatter plots in 4th experiment. (a) (b) Position A; (c)(d) position B
    Medium sound speed/ (m·s-1)1560158016001620164016601680
    Slope /(10-7dB·Hz-1)-1.23-1.19-1.16-1.12-1.09-1.05-1.02
    Intercept /dB-5.11799-5.17313-5.22837-5.28373-5.3391-5.39433-5.44923
    Table 1. K-wave simulation data
    No.SlopeIntercept
    Position APosition BPosition APosition B
    T10.9921900.4139730.9964430.952985
    T20.9656020.9994550.9888200.944841
    T30.6951210.9341420.8555730.793728
    T40.9998800.5276130.8294930.384515
    Table 2. Interaction-value of repetitive variance analysis of wavelength
    No.T1T2T3T4
    NA0.4278330.8924960.9560700.886299
    B0.9079100.5559900.5312680.404857
    N-V1A0.7062280.9124210.9358210.192570
    B0.7354920.2514930.2580770.104062
    N-V2A0.8884870.9211230.3418250.141270
    B0.5029810.3186720.3260700.166517
    N-V3A0.9612420.8192170.0073920.000751
    B0.3782580.2003990.0216960.000041
    N-V4A0.5834980.9562140.4001330.017631
    B0.9781300.5852180.0883060.000030
    Table 3. Significance level table for variance analysis
    Kang Xu, Cheng Wang, Mengjiao Zhang, Qian Chen, Huazhong Xiang, Gang Zheng. Photoacoustic Spectrum Analysis of Atherosclerotic Vessels[J]. Laser & Optoelectronics Progress, 2021, 58(12): 1217001
    Download Citation