
Yuhua Xing, Qinlin Duan. Generation Technology of High-Frequency and Large Time Bandwidth Product Linear Frequency Modulation Signal[J]. Laser & Optoelectronics Progress, 2022, 59(19): 1906004
- Laser & Optoelectronics Progress
- Vol. 59, Issue 19, 1906004 (2022)
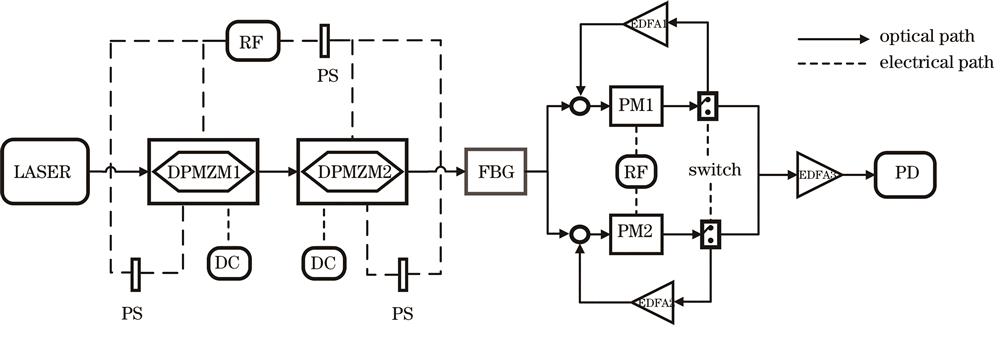
Fig. 1. Principle block diagram of high frequency LFM signal generation system
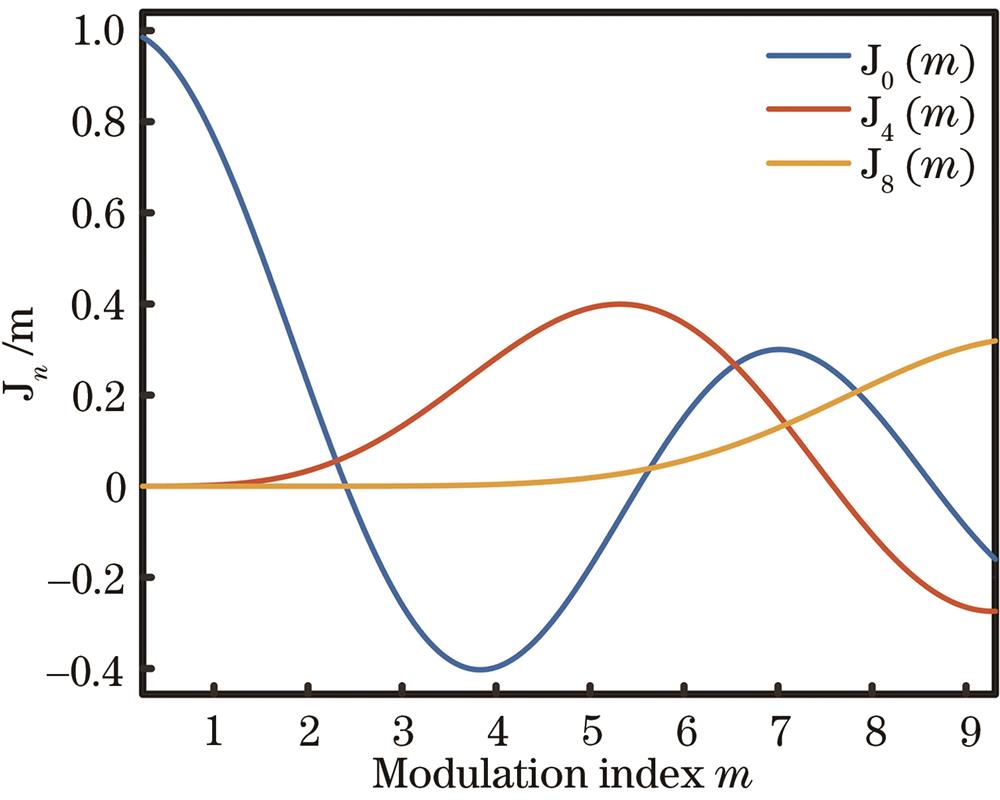
Fig. 2. Bessel function curve of order n
Fig. 3. Normalized parabola signal
Fig. 4. Output signal spectrum of DPMZM modulator. (a) Output spectrum of DPMZM1; (b) output spectrum of DPMZM2
Fig. 5. Normalized parabolic electrical signal. (a) Parabolic signal; (b) spectrum diagram; (c) autocorrelation function
Fig. 6. After quadrupling in time domain stretching. (a) Parabolic signal; (b) spectrum diagram; (c) autocorrelation function
Fig. 7. After 4-bit phase encoding processing. (a) Parabolic signal; (b) spectrum diagram; (c) autocorrelation function
Fig. 8. After segmentation. (a) Parabolic signal; (b) spectrum diagram; (c) autocorrelation function
Fig. 9. Combination of segmentation and phase encoding processing. (a) Parabolic signal; (b) spectrum diagram; (c) autocorrelation function
Fig. 10. Trend of OSSR with different modulation indices
Fig. 11. Trend of RFSSR with different modulation indices
Fig. 12. Effect of phase shift on OSSR
Fig. 13. Effect of phase shift on RFSSR
|
Table 1. Parameter comparison of LFM signal

Set citation alerts for the article
Please enter your email address
© Copyright 2018-2021 | Chinese Laser Press. All Rights Reserved 沪ICP备15018463号-20