• Journal of Inorganic Materials
  • Vol. 35, Issue 11, 1268 (2020)
Yaping HU1、2, Zhengfang TIAN2, Min ZHU1、*, and Yufang ZHU1、2、*
Author Affiliations
  • 1School of Materials Science and Engineering, University of Shanghai for Science and Technology, Shanghai 200093, China
  • 2Hubei Key Laboratory of Processing and Application of Catalytic Materials, College of Chemical Engineering, Huanggang Normal University, Huanggang 438000, China
  • show less
    DOI: 10.15541/jim20190621 Cite this Article
    Yaping HU, Zhengfang TIAN, Min ZHU, Yufang ZHU. Controllable Preparation and in Vitro Bioactivity of Bioglass Microspheres via Spray Drying Method[J]. Journal of Inorganic Materials, 2020, 35(11): 1268 Copy Citation Text show less
    SEM image (A), XRD pattern (B) and elemental mappings (C) of 77SBG microspheres obtained via spray-drying method
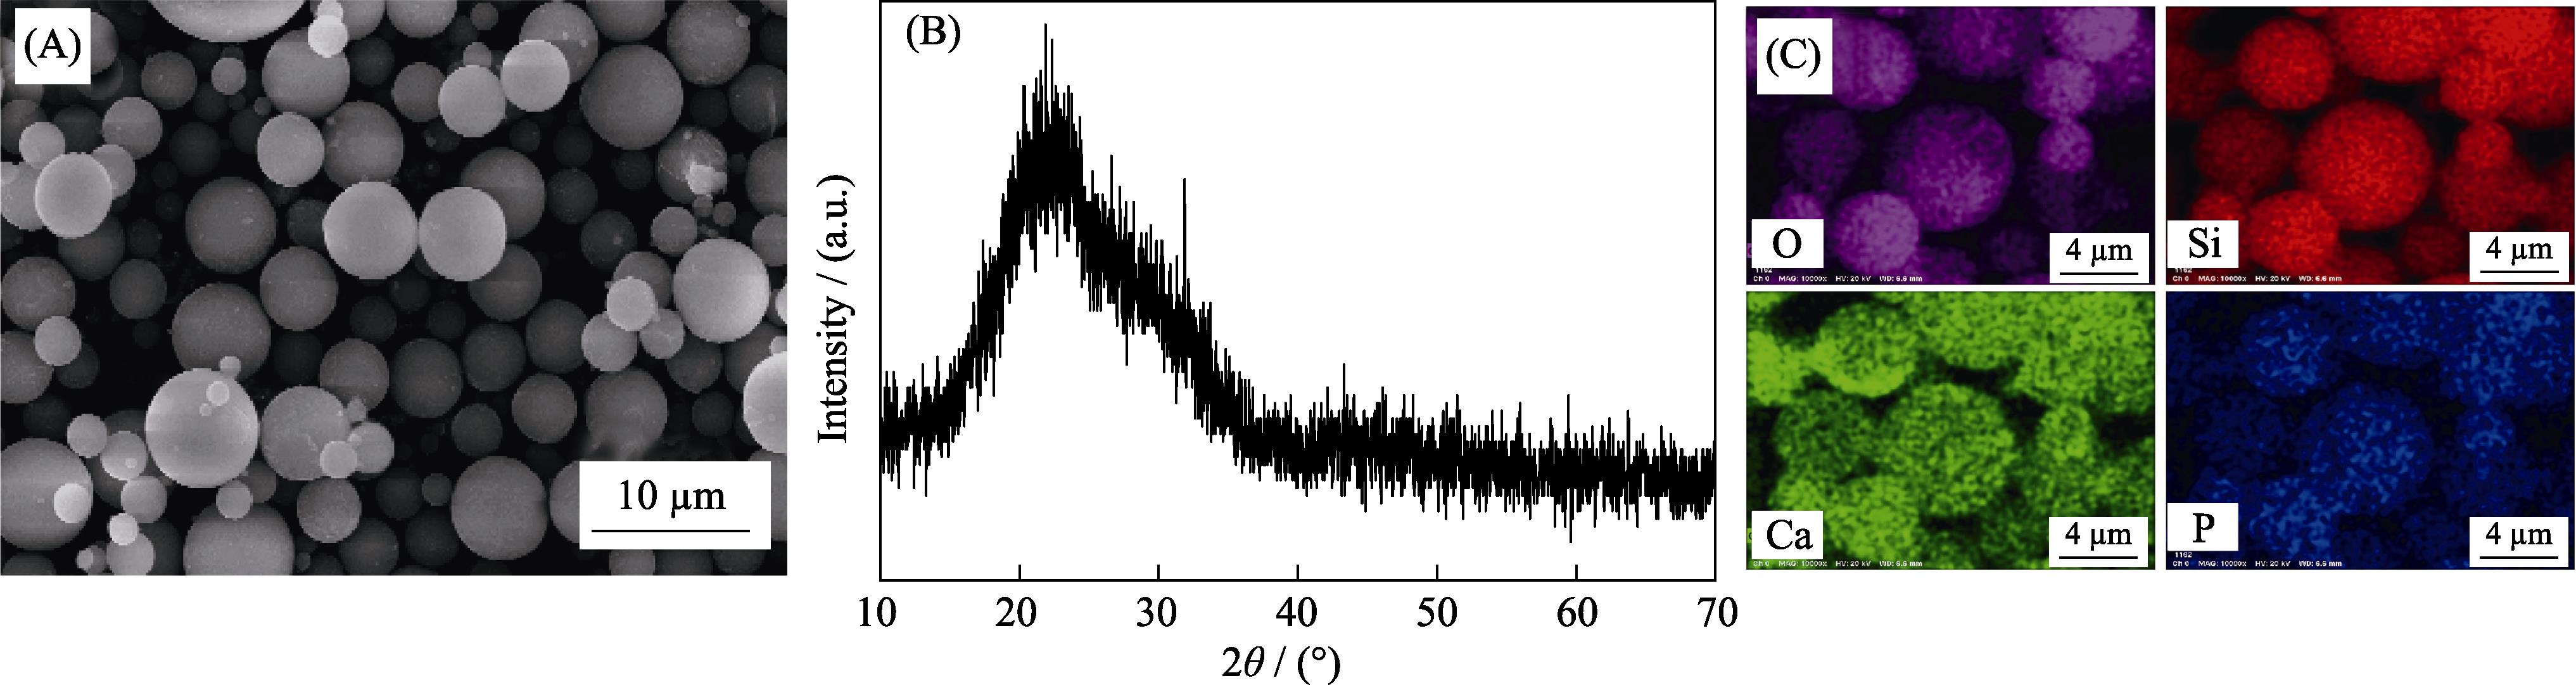
    1. SEM image (A), XRD pattern (B) and elemental mappings (C) of 77SBG microspheres obtained via spray-drying method
    SEM images and the particle size histogramms obtained by Imaje J statistics of 77SBG microspheres prepared with 5wt% precursor solution at inlet air volume of 283 (A1, A2), 439 (B1, B2), 667 (C1, C2) and 1052 L/h(D1, D2) when the feed rate was 6 mL/min
    2. SEM images and the particle size histogramms obtained by Imaje J statistics of 77SBG microspheres prepared with 5wt% precursor solution at inlet air volume of 283 (A1, A2), 439 (B1, B2), 667 (C1, C2) and 1052 L/h(D1, D2) when the feed rate was 6 mL/min
    SEM images and the particle size histogramms obtained by Imaje J statistics of 77SBG microspheres prepared with 5wt% (A1, A2), 15 wt% (B1, B2), 25wt% (C1, C2) and 35wt% (D1, D2) precursor solutions at the feed rate of 6 mL/min when the inlet air volume was 667 L/h
    3. SEM images and the particle size histogramms obtained by Imaje J statistics of 77SBG microspheres prepared with 5wt% (A1, A2), 15 wt% (B1, B2), 25wt% (C1, C2) and 35wt% (D1, D2) precursor solutions at the feed rate of 6 mL/min when the inlet air volume was 667 L/h
    SEM images and the particle size histogramms obtained by Imaje J statistics of 77SBG microspheres prepared with the 5wt% precursor solution at the feed rates of 1.5 mL/min (A1, A2), 3 mL/min (B1, B2), 4.5 mL/min (C1, C2) and 6 mL/min (D1, D2) when the inlet air volume was 1052 L/h.
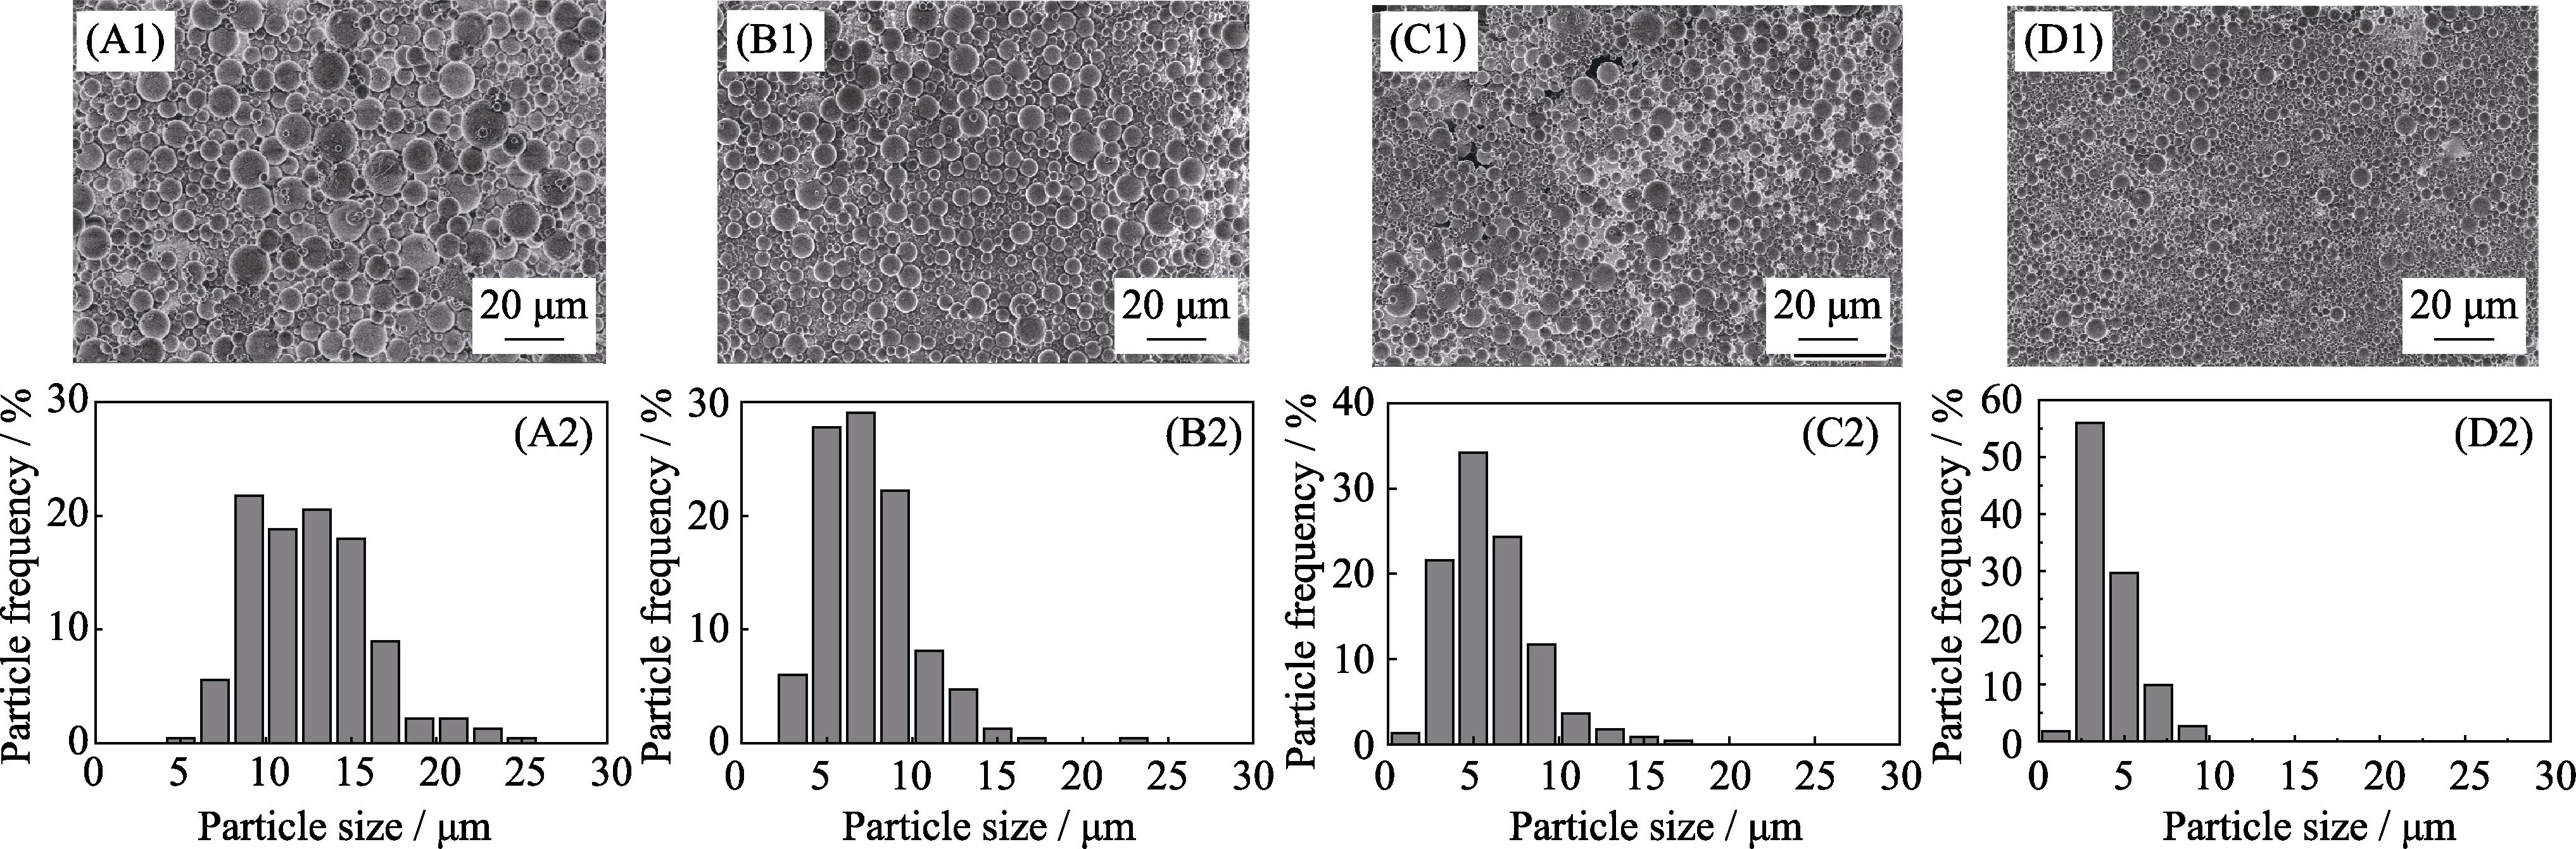
    4. SEM images and the particle size histogramms obtained by Imaje J statistics of 77SBG microspheres prepared with the 5wt% precursor solution at the feed rates of 1.5 mL/min (A1, A2), 3 mL/min (B1, B2), 4.5 mL/min (C1, C2) and 6 mL/min (D1, D2) when the inlet air volume was 1052 L/h.
    SEM images and the particle size histogramms obtained by Imaje J statistics of 58SBG (A1, A2), 68SBG (B1, B2), 77SBG (C1, C2) and 86SBG (D1, D2) microspheres after calcination at 700 ℃
    5. SEM images and the particle size histogramms obtained by Imaje J statistics of 58SBG (A1, A2), 68SBG (B1, B2), 77SBG (C1, C2) and 86SBG (D1, D2) microspheres after calcination at 700 ℃
    Wide-angle XRD patterns (A) and FT-IR spectra (B) of 58SBG, 68SBG, 77SSBG and 86SBG microspheres after calcination at 700 ℃
    6. Wide-angle XRD patterns (A) and FT-IR spectra (B) of 58SBG, 68SBG, 77SSBG and 86SBG microspheres after calcination at 700 ℃
    SEM images and EDS analysis of 58SBG (A), 68SBG (B), 77SSBG (C), and 86SBG (D) microspheres after soaking in SBF for 7 d
    7. SEM images and EDS analysis of 58SBG (A), 68SBG (B), 77SSBG (C), and 86SBG (D) microspheres after soaking in SBF for 7 d
    Wide-angle XRD patterns of 58SBG (A), 68SBG (B), 77SSBG (C) and 86SBG (D) microspheres before and after soaking in SBF for different periods
    8. Wide-angle XRD patterns of 58SBG (A), 68SBG (B), 77SSBG (C) and 86SBG (D) microspheres before and after soaking in SBF for different periods
    FTIR spectra of 58SBG (A), 68SBG (B), 77SBG (C) and 86SBG (D) microspheres before and after soaking in SBF for different periods
    9. FTIR spectra of 58SBG (A), 68SBG (B), 77SBG (C) and 86SBG (D) microspheres before and after soaking in SBF for different periods
    pH changes of Tris-HCl solutions after 58SBG, 68SBG, 77SBG and 86SBG microspheres soaking in Tris-HCl for different periods
    10. pH changes of Tris-HCl solutions after 58SBG, 68SBG, 77SBG and 86SBG microspheres soaking in Tris-HCl for different periods
    Concentration/wt%TEOS/gTEP/gCaNT/gDW/g
    526.82.925.6670
    1526.82.925.6200
    2526.82.925.6105
    3526.82.925.665
    Table 1. Preparation of precursor solutions with different mass concentrations
    SampleSiO2 : CaO : P2O5(Theo)SiO2 : CaO : P2O5 (Measured)TEOS/gTEP/gCaNT/g
    58SBG60 : 36 : 458.6 : 35.1 : 3.325.082.9217.04
    68SBG70 : 26 : 467.1 : 24.9 : 3.229.242.9212.31
    77SBG80 : 16 : 479.5 : 14.7 : 3.133.422.927.58
    86SBG90 : 6 : 489.7 : 5.1 : 3.637.592.922.84
    Table 2. Theoretical and measured chemical composition, amounts of the reactants of BG microspheres
    Yaping HU, Zhengfang TIAN, Min ZHU, Yufang ZHU. Controllable Preparation and in Vitro Bioactivity of Bioglass Microspheres via Spray Drying Method[J]. Journal of Inorganic Materials, 2020, 35(11): 1268
    Download Citation