• Laser & Optoelectronics Progress
  • Vol. 55, Issue 11, 110004 (2018)
Jiachen Wu1, Liangcai Cao1、*, Hailong Chen2, Xiang Peng2, and Guofan Jin1
Author Affiliations
  • 1 State Key Laboratory of Precision Measurement Technology and Instruments, Department of Precision Instruments, Tsinghua University, Beijing 100084, China
  • 2 Key Laboratory of Optoelectronic Devices and Systems of Ministry of Education and Guangdong Province, College of Optoelectronic Engineering, Shenzhen University, Shenzhen, Guangdong 518060, China
  • show less
    DOI: 10.3788/LOP55.110004 Cite this Article Set citation alerts
    Jiachen Wu, Liangcai Cao, Hailong Chen, Xiang Peng, Guofan Jin. Research Progress of Texture Reconstruction in Color Three-Dimensional Scanning[J]. Laser & Optoelectronics Progress, 2018, 55(11): 110004 Copy Citation Text show less
    Pinhole camera model
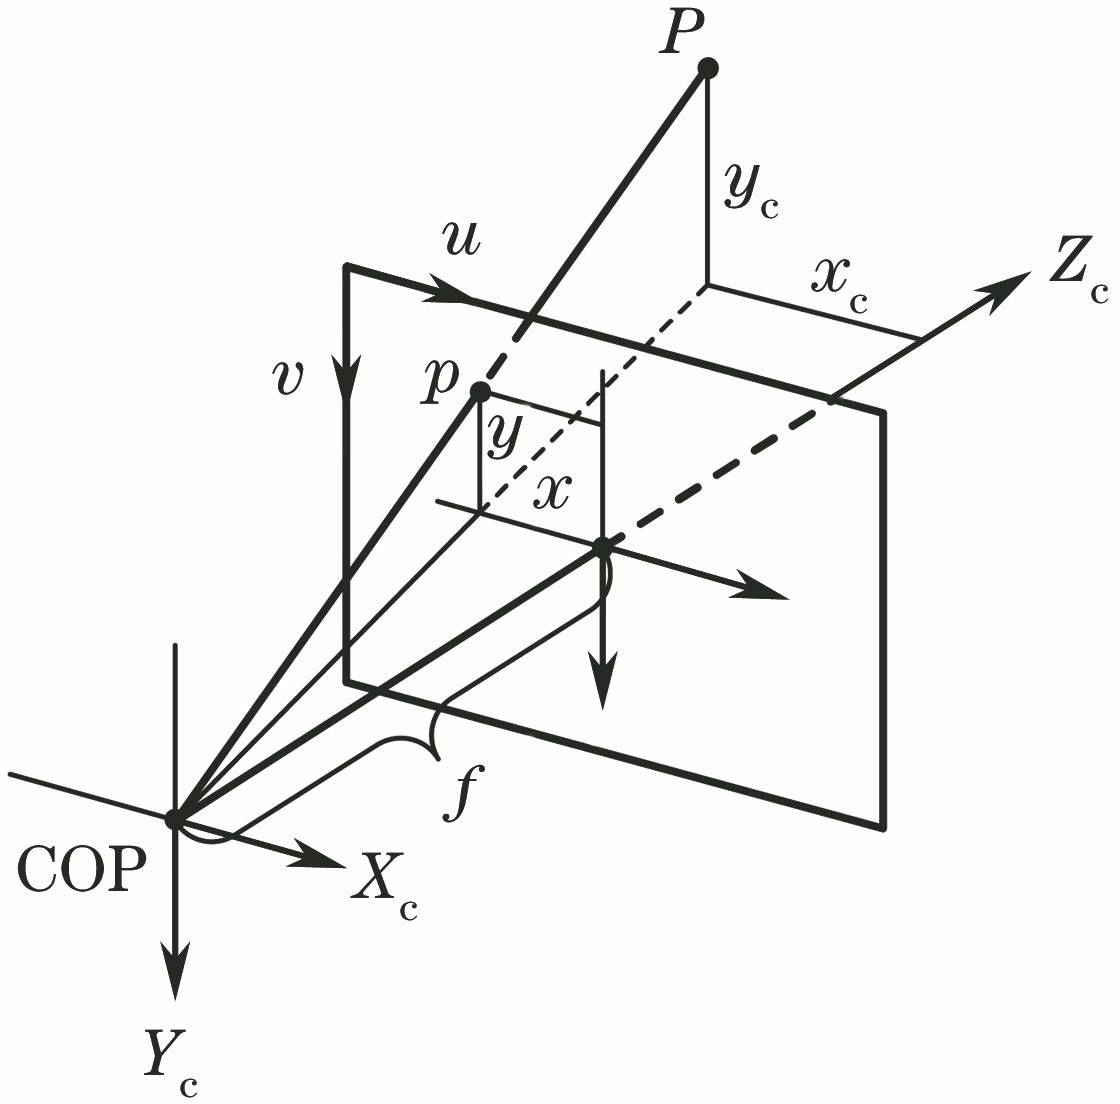
    Fig. 1. Pinhole camera model
    Causes of the artifacts in texture image. (a) Camera parameter errors; (b) low model accuracy; (c) inconsistent illumination environment; (d) texture aliasing
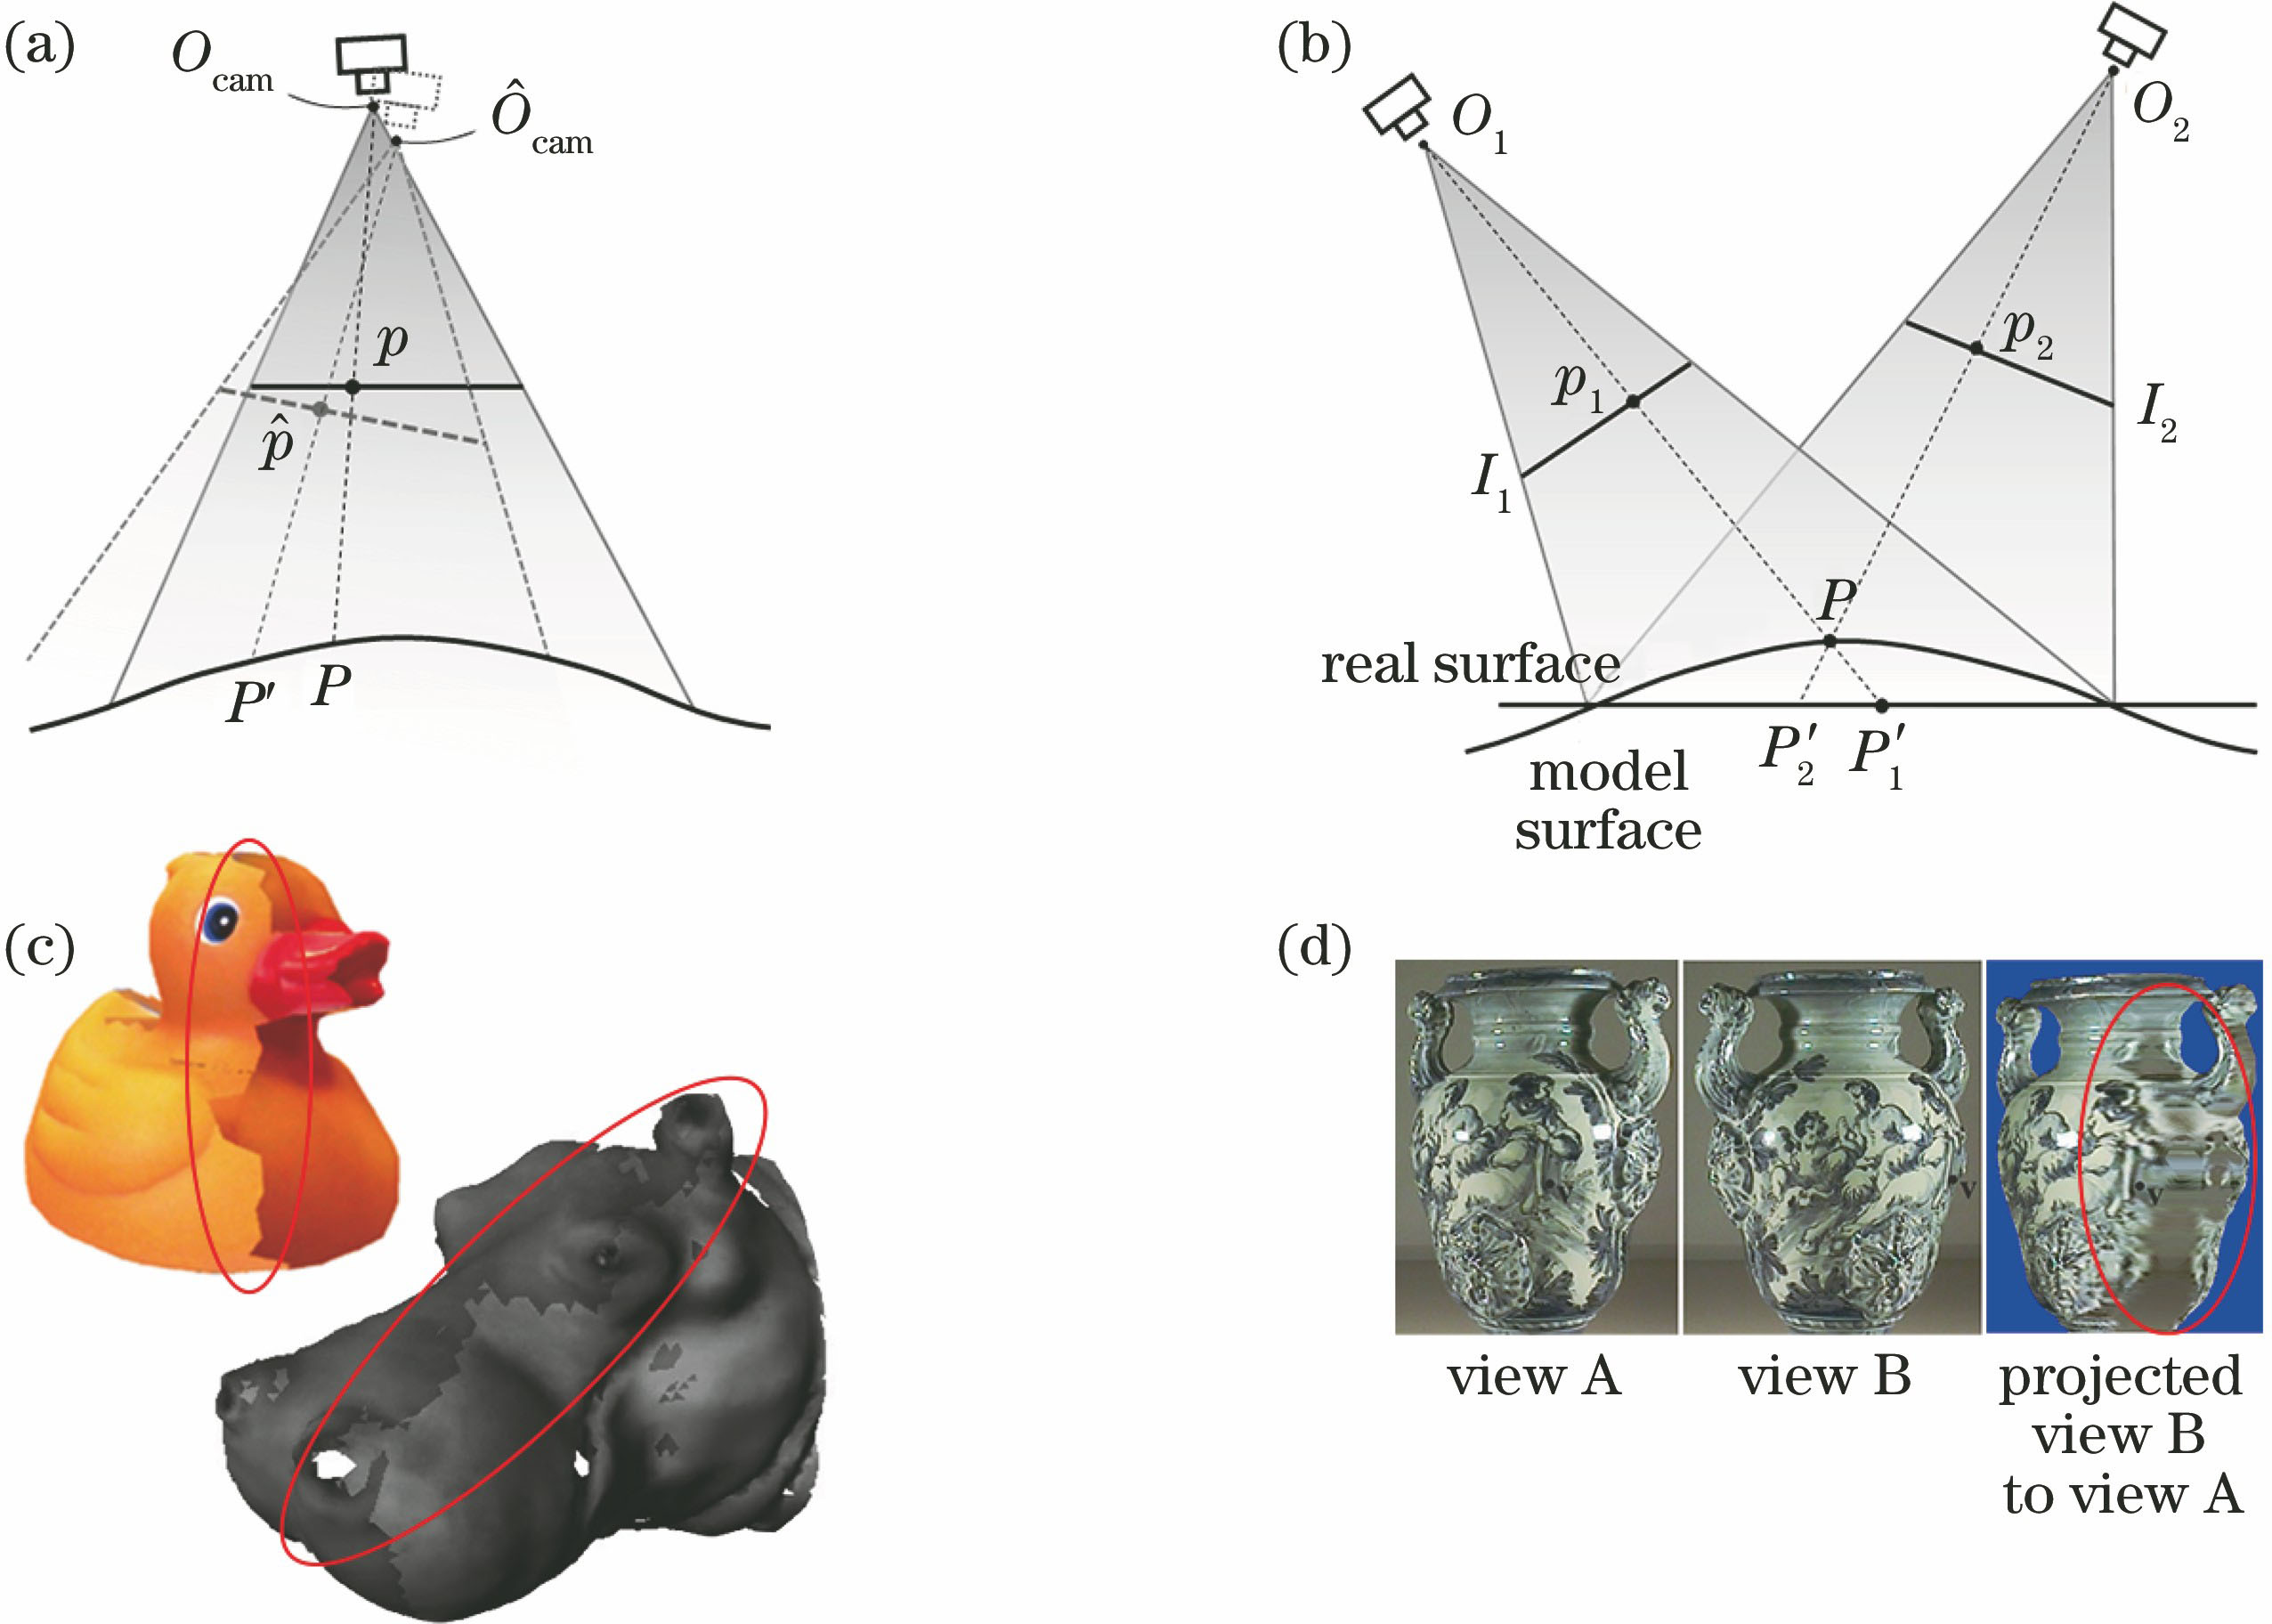
    Fig. 2. Causes of the artifacts in texture image. (a) Camera parameter errors; (b) low model accuracy; (c) inconsistent illumination environment; (d) texture aliasing
    Greedy algorithm diagram. (a) Triangulation texture distribution map obtained by texture quality optimal criterion; (b) triangulation texture distribution map redistributed by greedy algorithm
    Fig. 3. Greedy algorithm diagram. (a) Triangulation texture distribution map obtained by texture quality optimal criterion; (b) triangulation texture distribution map redistributed by greedy algorithm
    Composite-weight schematic. From left to right: angle weight, depth weight, border weight, and composite-weight
    Fig. 4. Composite-weight schematic. From left to right: angle weight, depth weight, border weight, and composite-weight
    BDS function diagram. Left: source image; right: target image. s1,t1 and s2,t2 are two pairs of patches between source and target images which have minimum Euclidean distance, respectively
    Fig. 5. BDS function diagram. Left: source image; right: target image. s1,t1 and s2,t2 are two pairs of patches between source and target images which have minimum Euclidean distance, respectively
    Comparison of reconstruction results of different texture reconstruction methods
    Fig. 6. Comparison of reconstruction results of different texture reconstruction methods
    Influence of illumination disagreement on the method in Ref.[73]. Each row gives the source texture image and the target texture image in the experiment, and the illumination disagreement increases gradually from top to bottom
    Fig. 7. Influence of illumination disagreement on the method in Ref.[73]. Each row gives the source texture image and the target texture image in the experiment, and the illumination disagreement increases gradually from top to bottom
    Poisson image editing diagram
    Fig. 8. Poisson image editing diagram
    Seam levelling on a circumference. Function values are shown as the height above the circumference. (a) Original function; (b) levelling function; (c) sum of original function and levelling function (minus a constant)
    Fig. 9. Seam levelling on a circumference. Function values are shown as the height above the circumference. (a) Original function; (b) levelling function; (c) sum of original function and levelling function (minus a constant)
    Texture setNaiveWaechterZhouBi
    InaccurategeometryRegion 10.3920.5230.5230.680
    Region 20.5590.6930.6460.737
    Inaccurate cameraparameterRegion 30.4110.3650.6800.682
    Region 40.4230.3660.5330.601
    Table 1. SSIM value of different reconstruction methods
    Jiachen Wu, Liangcai Cao, Hailong Chen, Xiang Peng, Guofan Jin. Research Progress of Texture Reconstruction in Color Three-Dimensional Scanning[J]. Laser & Optoelectronics Progress, 2018, 55(11): 110004
    Download Citation