
Shijie Deng, Haiyan Wang, Mengai Wang, Chengzhe Fang. Spectral Matching Operator Based on Position Vector Statistics[J]. Laser & Optoelectronics Progress, 2021, 58(16): 1610013
- Laser & Optoelectronics Progress
- Vol. 58, Issue 16, 1610013 (2021)
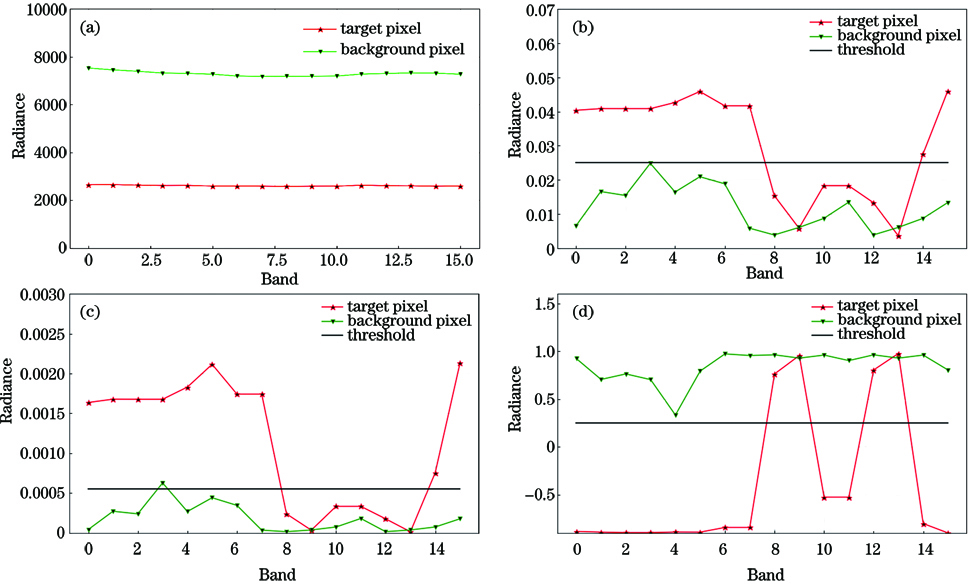
Fig. 1. Spectra of spectral matching operator based on position vector statistics. (a) Original spectral curves; (b) results of SAM; (c) results of SID; (d) results of SCM
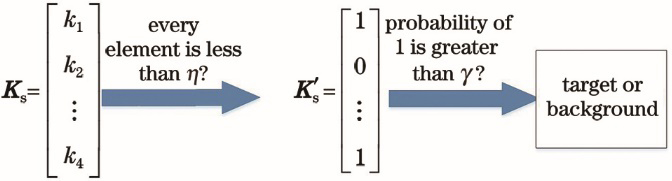
Fig. 2. Flowchart of voting statistics
Fig. 3. Flowchart of operators
Fig. 4. Pixel spectral curve and fitting curve of eigenmatrix
Fig. 5. Visualization results of operator. (a) Pixels of the same class; (b) pixels of different classes
Fig. 6. ROC curves
Fig. 7. Target location diagram. (a) Data 1; (b) data 2
Fig. 8. Recognition effects of single operator in data 1. (a) SAM; (b) SID; (c) SCM; (d) PVS
Fig. 9. Recognition effects of single operator in data 2. (a) SAM; (b) SID; (c) SCM; (d) PVS
Fig. 10. ROC curves. (a) Data 1; (b) data 2
Fig. 11. Two types of pixels with similar spectral curves
Fig. 12. Recognition effects of data 1. (a) CEM; (b) OSP; (c) SAM,SID,SCM fusion; (d) SAM,SID,SCM,PVS fusion
Fig. 13. Recognition effects of data 2 . (a) WCM-CEM; (b) WCM-OSP; (c) SAM,SID,SCM fusion; (d) SAM,SID,SCM,PVS fusion
Fig. 14. ROC curves. (a) Data 1; (b)data 2
| ||||||||||||||||||||||||||||
Table 1. Pd and Pf of single operator unit: %
|
Table 2. Pd and Pf of algorithms before fusion unit: %
| ||||||||||||||||||||||||||||
Table 3. Pd and Pf after fusion unit: %

Set citation alerts for the article
Please enter your email address
© Copyright 2018-2021 | Chinese Laser Press. All Rights Reserved 沪ICP备15018463号-20