• Photonics Research
  • Vol. 6, Issue 6, 609 (2018)
Francis Théberge1、*, Nancy Bérubé1, Samuel Poulain2, Solenn Cozic2, Louis-Rafaël Robichaud3, Martin Bernier3, and Réal Vallée3
Author Affiliations
  • 1Defence R&D Canada, Valcartier Centre, Québec G3J 1X5, Canada
  • 2Le Verre Fluoré, Campus KerLann, F-35170 Bruz, Brittany, France
  • 3Center for Optics, Photonics and Lasers (COPL), Université Laval, Québec G1V 0A6, Canada
  • show less
    DOI: 10.1364/PRJ.6.000609 Cite this Article Set citation alerts
    Francis Théberge, Nancy Bérubé, Samuel Poulain, Solenn Cozic, Louis-Rafaël Robichaud, Martin Bernier, Réal Vallée. Watt-level and spectrally flat mid-infrared supercontinuum in fluoroindate fibers[J]. Photonics Research, 2018, 6(6): 609 Copy Citation Text show less
    (a) Experimental setup of the MIR SC fiber source. PA, pre-amplifier; CMS, cladding mode stripper; DCF, double-clad fiber; SCF, single-clad fiber; ISO, 2 μm optical isolator (Thorlabs, IO-K-2000); L, fiber length. (b) Spectral distribution of the Er/Yb amplifier (blue line), output of the fiber isolator (green line), and the Tm amplifier (black and red lines).
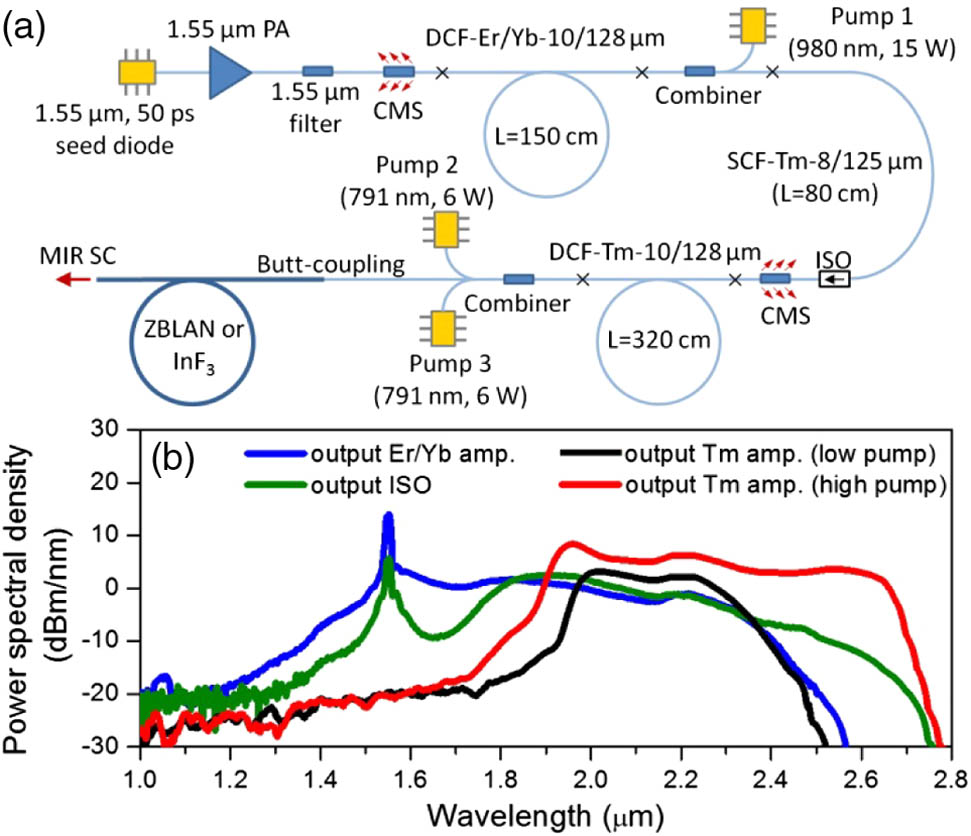
    Fig. 1. (a) Experimental setup of the MIR SC fiber source. PA, pre-amplifier; CMS, cladding mode stripper; DCF, double-clad fiber; SCF, single-clad fiber; ISO, 2 μm optical isolator (Thorlabs, IO-K-2000); L, fiber length. (b) Spectral distribution of the Er/Yb amplifier (blue line), output of the fiber isolator (green line), and the Tm amplifier (black and red lines).
    (a) Spectral distribution of the Tm amplifier (black line) injected into fluoride fibers. The SCs from the 20-m ZBLAN and 20-m InF3 fibers are shown with red, green, and blue lines, respectively. Corresponding SC output average powers are indicated in parentheses in the legend. (b) Measured attenuation and (c) calculated dispersion spectra of ZBLAN and InF3 fibers. (d) Calculated mode field diameter (MFD) of fundamental modes in ZBLAN, InF3, and silica fibers as a function of wavelength.
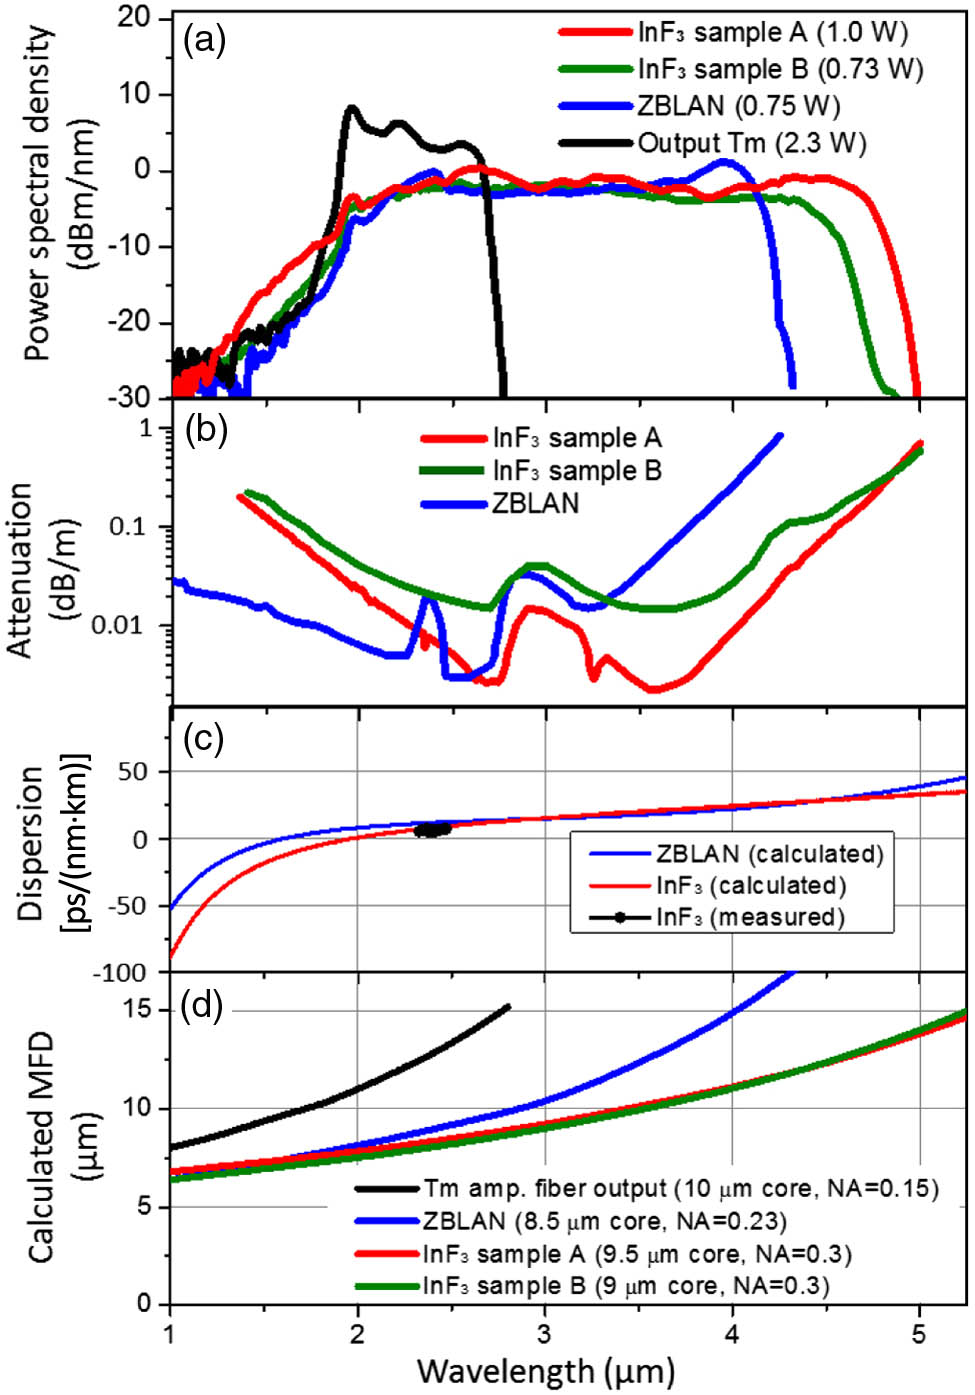
    Fig. 2. (a) Spectral distribution of the Tm amplifier (black line) injected into fluoride fibers. The SCs from the 20-m ZBLAN and 20-m InF3 fibers are shown with red, green, and blue lines, respectively. Corresponding SC output average powers are indicated in parentheses in the legend. (b) Measured attenuation and (c) calculated dispersion spectra of ZBLAN and InF3 fibers. (d) Calculated mode field diameter (MFD) of fundamental modes in ZBLAN, InF3, and silica fibers as a function of wavelength.
    (a) Spectral distribution at the output of the 20-m long InF3 fiber (sample A) for different pump powers. (b) Spectral distribution at the output of the InF3 fiber (sample A) for different fiber lengths. The laser power from the Tm amplifier was fixed to 2.3 W.
    Fig. 3. (a) Spectral distribution at the output of the 20-m long InF3 fiber (sample A) for different pump powers. (b) Spectral distribution at the output of the InF3 fiber (sample A) for different fiber lengths. The laser power from the Tm amplifier was fixed to 2.3 W.
    (a) 10-dB spectral bandwidth as a function of the SC output power. (b) SC output power as a function of the Tm amplifier output power. (c) Spectral distribution at the output of fluoride fibers. The laser power from the Tm amplifier was fixed to 2.3 W for the three cases presented, and the SC output powers are indicated in parenthesis.
    Fig. 4. (a) 10-dB spectral bandwidth as a function of the SC output power. (b) SC output power as a function of the Tm amplifier output power. (c) Spectral distribution at the output of fluoride fibers. The laser power from the Tm amplifier was fixed to 2.3 W for the three cases presented, and the SC output powers are indicated in parenthesis.
    ReferenceShort Description20 dB Spectral Range (μm)Average Power (W)
    [11]70 fs OPA (λc=3.4  μm) injected in 16 μm core InF3 fiber2.6–4.80.0001
    [12]Er-ZBLAN fiber amplifier injected in 13.5 μm core InF3 fiber2.5–5.30.008
    [13]70 ps OPO (λc=2.02  μm) injected in 9 μm core InF3 fiber1.9–5.30.008
    [23]100 fs Tm-doped silica fiber laser injected in 7 μm core InF3 fibers1.25–4.20.25
    [6]100 ns Tm-doped silica fiber laser injected in 16.7 μm core InF3 fibers1.9–2.41.02
    [24]1 ns Er-doped and Tm-doped silica fiber injected in 9 μm core InF3 fiber1.87–3.91.4
    [25]35 ps Tm-doped silica fiber injected in 9 μm core InF3 fiber1.7–4.31.76
    [26]1 ns Er-doped silica fiber laser injected in 16.7 μm core InF3 fibers1.05–2.652.09
    Table 1. Characteristics of Fluoroindate-Fiber-Based SC Laser Sourcesa
    ParameterZBLANInF3 Sample_AInF3 Sample_B
    Core diameter (μm)8.59.59
    Clad diameter (μm)125100100
    ZDW (μm)1.61.91.9
    NA0.230.30.3
    Cutoff (μm)2.43.73.4
    Min. MIR loss (dB/m)0.0030.0020.015
    ManufacturerLVFLVFLVF
    Table 2. Fiber Parameters Summarya
    Francis Théberge, Nancy Bérubé, Samuel Poulain, Solenn Cozic, Louis-Rafaël Robichaud, Martin Bernier, Réal Vallée. Watt-level and spectrally flat mid-infrared supercontinuum in fluoroindate fibers[J]. Photonics Research, 2018, 6(6): 609
    Download Citation