Author Affiliations
1School of Geographic and Environmental Sciences, Tianjin Normal University, Tianjin 300387, China2Key Laboratory of Regional Sustainable Development Modeling, Institute of Geographic Sciences and Natural Resources Research, CAS, Beijing 100101, China3University of Chinese Academy of Sciences, Beijing 100049, Chinashow less
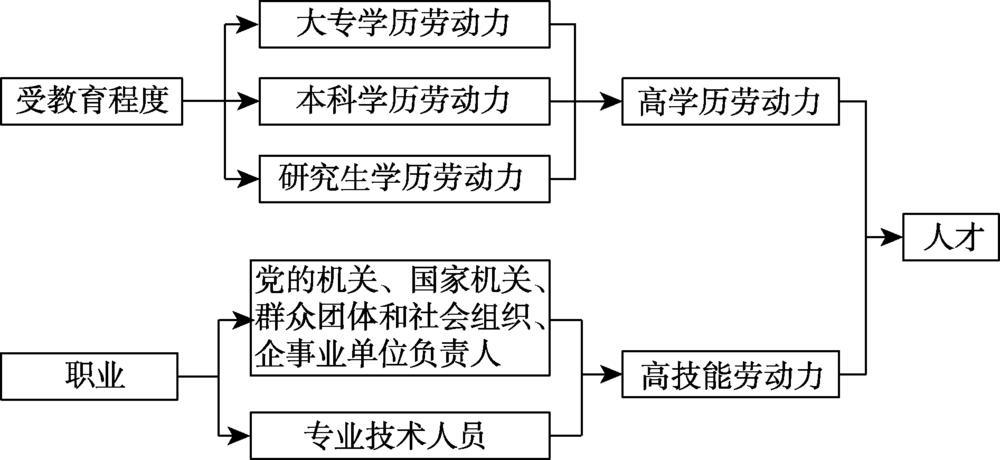
Fig. 1. Definitions of talents in China
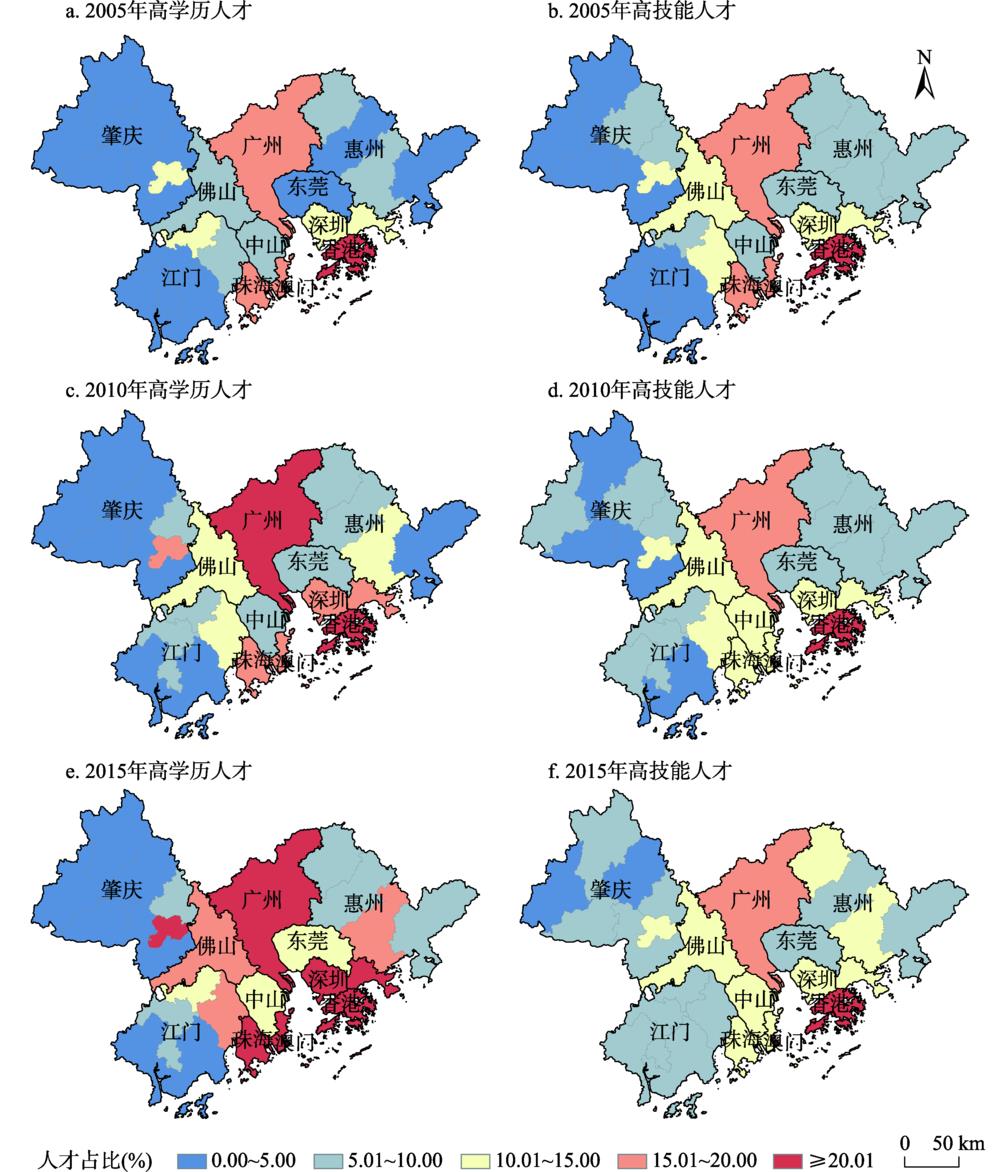
Fig. 2. Spatial distribution of the share of talents in the Guangdong-Hong Kong-Macao Greater Bay Area from 2005 to 2015
Fig. 3. Service and manufacturing employment share of different counties in the Guangdong-Hong Kong-Macao Greater Bay Area in 2015
Fig. 4. The correlations between shares of highly-educated and highly-skilled talents
Fig. 5. Relationships among highly-educated, less-educated, highly-skilled and lowed-skilled workers in 2015
Fig. 6. Talents share comparisons among Hong Kong, Macao and prefecture-level cities in the Pearl River Delta in 2015
Fig. 7. The gap between the level of concentration of highly-educated and highly-skilled talents
城市群 | 高学历人才占比与规模 | | 高技能人才占比与规模 |
---|
2005年 | 2010年 | 2015年 | 2005年 | 2010年 | 2015年 |
---|
粤港澳大湾区 | 12.47 | 16.35 | 22.13 | | 12.81 | 14.07 | 15.17 | | (402.26) | (649.59) | (858.78) | (413.04) | (558.99) | (588.47) | 其中:珠三角 | 9.59 | 13.56 | 19.28 | 10.20 | 11.96 | 12.52 | | (274.96) | (487.01) | (667.59) | (292.58) | (429.63) | (433.35) | 京津冀 | 10.21 | 14.83 | 21.28 | 12.58 | 11.41 | 14.08 | | (527.04) | (853.95) | (1193.72) | (649.03) | (657.03) | (789.77) | 长江三角洲 | 9.30 | 14.81 | 20.03 | 10.26 | 12.70 | 14.00 | | (720.74) | (1332.83) | (1769.11) | (794.98) | (1143.50) | (1236.60) |
|
Table 1. Talents distribution of top three urban agglomerations in China
城市群 | 2015人均GDP(万元) | 2015年第三产业就业人口占比(%) | 211高校数量 |
---|
粤港澳大湾区 | 12.66 | 46.55 | 11 | 其中:珠三角 | 10.60 | 42.06 | 4 | 京津冀 | 7.05 | 45.51 | 31 | 长江三角洲 | 10.26 | 42.30 | 22 |
|
Table 2. Statistics of employment, economy and education of top three urban agglomerations in China
| 2005年 | 2010年 | 2015年 |
---|
高学历人才 | 1.00 | 0.88 | 0.83 | 高技能人才 | 0.77 | 0.67 | 0.70 |
|
Table 3. The coefficient of variance of the share of highly-educated and highly-skilled workers
符号 | 变量说明 | Obs | 2005年 | | 2010年 | | 2015年 |
---|
Mean | Std | Mean | Std | Mean | Std |
---|
MAU | 制造业劳动力占就业人口的比例(%) | 24 | 28.13 | 20.90 | | 31.56 | 21.05 | | 30.02 | 17.63 | TER | 服务业劳动力占就业人口的比例(%) | 24 | 30.87 | 18.90 | 33.22 | 20.14 | 40.15 | 19.05 | WAG | 职工平均工资(元) | 24 | 24643.20 | 25964.90 | 37212.60 | 20993.30 | 62719.10 | 27184.00 | MED | 每万人医疗卫生机构床位数(张/万人) | 24 | 23.06 | 11.43 | 25.34 | 11.23 | 38.36 | 19.36 | EDU | 每千人高学历在校生(人/千人) | 24 | 8.90 | 15.78 | 13.62 | 25.35 | 18.16 | 32.30 | MST | 中学在校生与教师的比值 | 24 | 18.47 | 1.81 | 16.12 | 1.63 | 12.97 | 1.49 |
|
Table 4. Description and statistics of explanatory variables
| 高学历人才占比 | 高技能人才占比 |
---|
MAU | -0.187 | 0.019 | 0.052 | 0.026 | | (-1.602) | (0.293) | (0.643) | (0.664) | TER | 0.961*** | 0.750*** | 0.850*** | 0.840*** | | (3.742) | (4.562) | (4.801) | (8.039) | WAG | 0.533*** | 0.305*** | 0.110 | 0.105 | | (3.951) | (2.834) | (1.177) | (1.492) | MST | 0.385 | -0.089 | 0.067 | 0.147 | | (1.108) | (-0.313) | (0.279) | (0.772) | MED | -0.478** | -0.205 | -0.389*** | -0.285*** | | (-2.589) | (-1.427) | (-3.056) | (-3.034) | EDU | 0.357*** | 0.236*** | 0.084 | 0.097*** | | (2.833) | (4.298) | (0.971) | (2.811) | _cons | -6.189*** | -3.155* | -1.104 | -1.520 | | (-2.848) | (-1.868) | (-0.737) | (-1.360) | N | 72 | 72 | 72 | 72 | R2 | 0.738 | 0.852 | 0.557 | 0.856 | Hausman′s p | 0.128 | | 0.118 | | Model | FE | RE | FE | RE |
|
Table 5. Regression results of drivers of talent concentration