• Spectroscopy and Spectral Analysis
  • Vol. 41, Issue 2, 624 (2021)
Chen-yang LI1、1、*, Xiong-fei CHEN1、1, Yong ZHANG1、1, Ya-wen WANG1、1, Zhong-chao TIAN1、1, Shi-gong WANG1、1, Zhen-yang ZHAO1、1, Ying LIU1、1, and Peng-yu LIU1、1
Author Affiliations
  • 1[in Chinese]
  • 11. National Analysis and Testing Center of Nonferrous Metals and Electronic Materials, GRINM Group Corporation Limited, Beijing 100088, China
  • show less
    DOI: 10.3964/j.issn.1000-0593(2021)02-0624-05 Cite this Article
    Chen-yang LI, Xiong-fei CHEN, Yong ZHANG, Ya-wen WANG, Zhong-chao TIAN, Shi-gong WANG, Zhen-yang ZHAO, Ying LIU, Peng-yu LIU. Study on Identification Method Based on XGBoost Model for Aluminum Alloy Using Laser-Induced Breakdown Spectroscopy[J]. Spectroscopy and Spectral Analysis, 2021, 41(2): 624 Copy Citation Text show less
    The schematic diagram of LIBS experiment setup
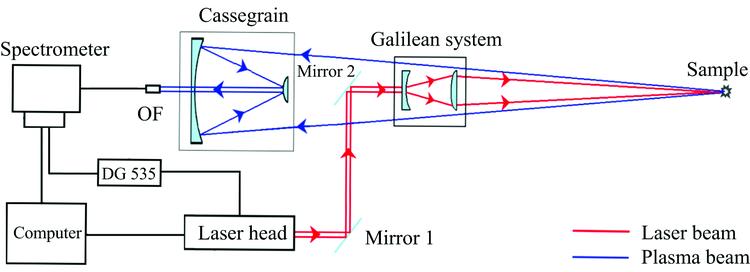
    Fig. 1. The schematic diagram of LIBS experiment setup
    The spectral matrices of six kinds of standard aluminium alloy
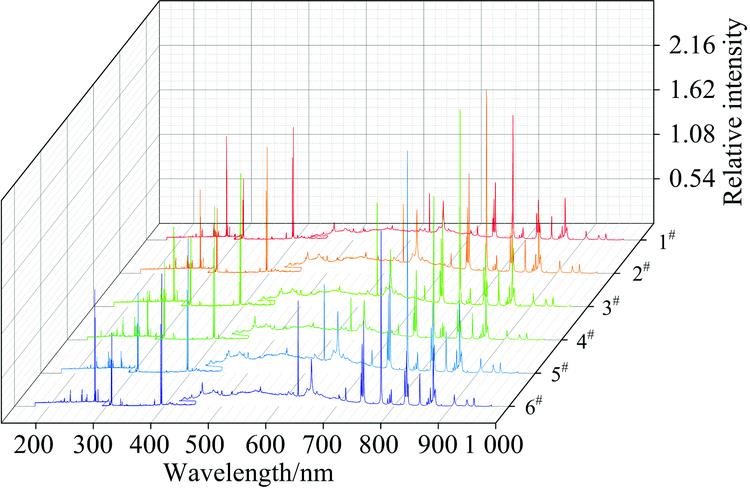
    Fig. 2. The spectral matrices of six kinds of standard aluminium alloy
    The feature importance scores given by XGBoost
    Fig. 3. The feature importance scores given by XGBoost
    Distribution map of spectral data under 4 featres of XGBoost model
    Fig. 4. Distribution map of spectral data under 4 featres of XGBoost model
    编号No.SiFeCuMnMgCrNiZnTi
    1#0.5410.2060.0400.8641.1700.0350.0590.2970.114
    2#1.0100.3630.2280.5220.6930.1610.0430.2260.055
    3#1.2400.4280.4870.2330.9330.3540.0270.0940.026
    4#0.2350.6970.7051.1800.4110.2180.0890.1660.066
    5#1.5800.8480.0781.4800.0680.2880.1150.0410.008
    6#0.0520.0740.9270.0421.4600.0390.0130.3610.160
    Table 1. The values concentration (Wt.%) of impurity elements in six alloys
    分析元素分析谱线(NIST)/nm
    Si250.69, 251.61
    Fe259.94
    Cu324.75, 327.40
    Mn259.37
    Cr357.87
    Ni232.00
    Zn213.86
    Ti334.94
    Table 2. Spectral lines for analysis
    超参数取值
    迭代模型gbtree
    损失函数Multi∶Softmax
    学习率0.1
    树的深度6
    L2正则化参数2
    类别数6
    Table 3. Super parameters of XGBoost model
    分析元素变异系数
    Cu0.871 2
    Ti0.792 2
    Mn0.772 1
    Si0.770 4
    Cr0.712 8
    Fe0.670 4
    Ni0.668 1
    Mg0.643 2
    Table 4. The Coefficient of Variation of all analytical elements
    1#2#3#4#5#6#准确率/%
    1#36294.73
    2#22195.65
    3#226189.66
    4#35100
    5#27100
    6#28100
    总体96.67
    Table 5. Identification results of Test Sets
    Chen-yang LI, Xiong-fei CHEN, Yong ZHANG, Ya-wen WANG, Zhong-chao TIAN, Shi-gong WANG, Zhen-yang ZHAO, Ying LIU, Peng-yu LIU. Study on Identification Method Based on XGBoost Model for Aluminum Alloy Using Laser-Induced Breakdown Spectroscopy[J]. Spectroscopy and Spectral Analysis, 2021, 41(2): 624
    Download Citation