
Yifei Wang, Zhou Yu, Kangmei Li, Jun Hu. Numerical Simulation of Micro-pit Morphology of Titanium Alloy Ablated by Nanosecond Laser[J]. Chinese Journal of Lasers, 2022, 49(8): 0802008
- Chinese Journal of Lasers
- Vol. 49, Issue 8, 0802008 (2022)
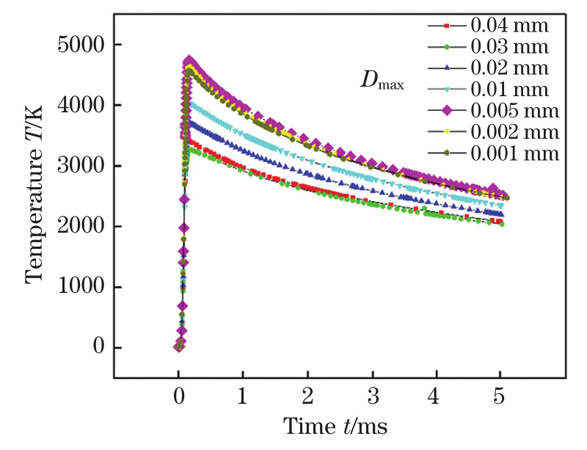
Fig. 1. Mesh convergence analysis
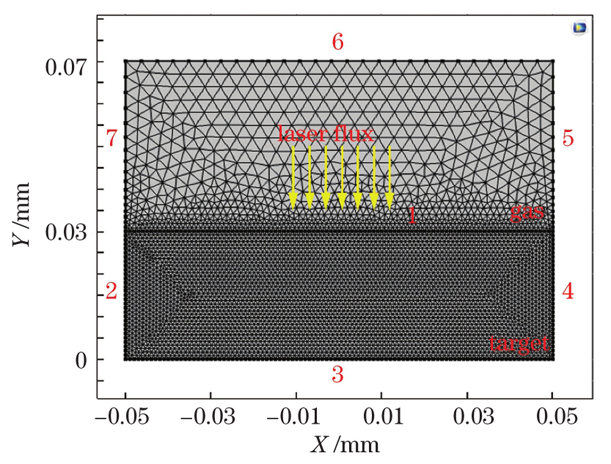
Fig. 2. Setting of grid and boundary conditions
Fig. 3. Change of ablation temperature within a single pulse period. (a) Ablation time is 150 ns; (b) ablation time is 450 ns; (c) ablation time is 2 μs; (d) ablation time is 4 μs
Fig. 4. Influence of heat dissipation conditions on temperature field. (a) Temperature change during two ablation cycles; (b) effect of thermal conductivity; (c) effect of air convection; (d) effect of surface radiation
Fig. 5. Temperature field in the second pulse period. (a) Ablation time is 20 μs; (b) ablation time is 20.10 μs; (c) ablation time is 20.15 μs; (d) ablation time is 20.20 μs
Fig. 6. Velocity field within a single pulse period when Marangoni is not considered. (a) Ablation time is 100 ns; (b) ablation time is 150 ns; (c) ablation time is 200 ns; (d) ablation time is 1000 ns
Fig. 7. Velocity field in a single pulse period when Marangoni is considered. (a) Ablation time is 100 ns; (b) ablation time is 150 ns; (c) ablation time is 200 ns; (d) ablation time is 1000 ns
Fig. 8. Melting and vaporization processes of titanium alloy. (a) Ablation time is 90 ns; (b) ablation time is 120 ns; (c) ablation time is 200 ns; (d) ablation time is 1.5 μs
Fig. 9. Liquid phase migration and sputtering. (a) Ablation time is 3 μs; (b) ablation time is 3.5 μs; (c) ablation time is 3.6 μs; (d) ablation time is 3.65 μs
Fig. 10. Solidification process of liquid titanium alloy. (a) Ablation time is 5 μs; (b) ablation time is 10 μs; (c) ablation time is 15 μs; (d) ablation time is 20 μs
Fig. 11. Surface morphology of titanium alloy micro-pits. (a) Pa=7.5 W, f=20 kHz, N=1; (b) Pa=20 W, f=50 kHz, N=1
Fig. 12. Simulation and experimental morphologies when number of ablations is 1 and 3. (a) Simulated morphology when number of ablation is 1; (b) simulated morphology when number of ablation is 3; (c) optical morphology when number of ablation is 1; (d) optical morphology number of ablation is 3
Fig. 13. Comparison of experimental sizes and simulation results. (a) H1 and H2;(b) D1and D2
Fig. 14. Influence of laser process parameters on ablation size. (a) Effect of laser flux on ablation area;(b)(d) changes of migration speed and size of liquid phase in different ablation stages when number of ablation times is 10
Fig. 15. Parameter from ablation center to ablation edge at different ablation times in the tenth pulse period. (a) Temperature; (b) recoil pressure; (c) X component of surface tension ; (d) Y component of surface tension
|
Table 1. Variation of average power with repetition frequency
|
Table 2. Chemical composition of Ti6Al4V
|
Table 3. Thermodynamic parameters of titanium alloy

Set citation alerts for the article
Please enter your email address
© Copyright 2018-2021 | Chinese Laser Press. All Rights Reserved 沪ICP备15018463号-20