• Spectroscopy and Spectral Analysis
  • Vol. 40, Issue 12, 3906 (2020)
Hui WANG1、1, Cheng JIN1、1, Lei ZHAO1、1, Lei YU1、1, Fei LIN1、1, Xiao-fei SUN1、1, and Yun-hai JIA1、1
Author Affiliations
  • 1[in Chinese]
  • 11. Central Iron and Steel Research Institute, Beijing 100081, China
  • show less
    DOI: 10.3964/j.issn.1000-0593(2020)12-3906-06 Cite this Article
    Hui WANG, Cheng JIN, Lei ZHAO, Lei YU, Fei LIN, Xiao-fei SUN, Yun-hai JIA. Original Position Statistic Distribution Analysis of Continuous Casting Round Billet of 18CrNiMo7-6 Low and Middle Alloy Steel[J]. Spectroscopy and Spectral Analysis, 2020, 40(12): 3906 Copy Citation Text show less
    Schematic diagram of the sample position
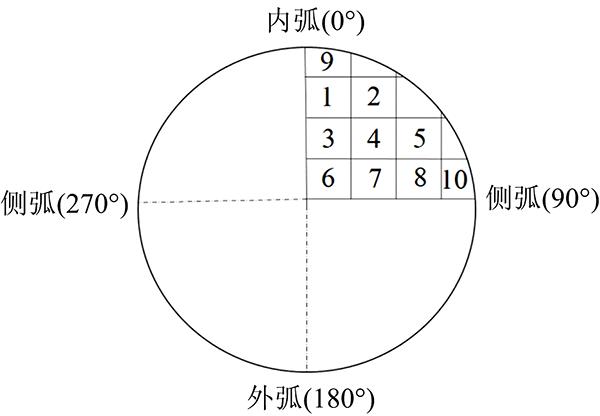
    Fig. 1. Schematic diagram of the sample position
    Overall distribution of each element
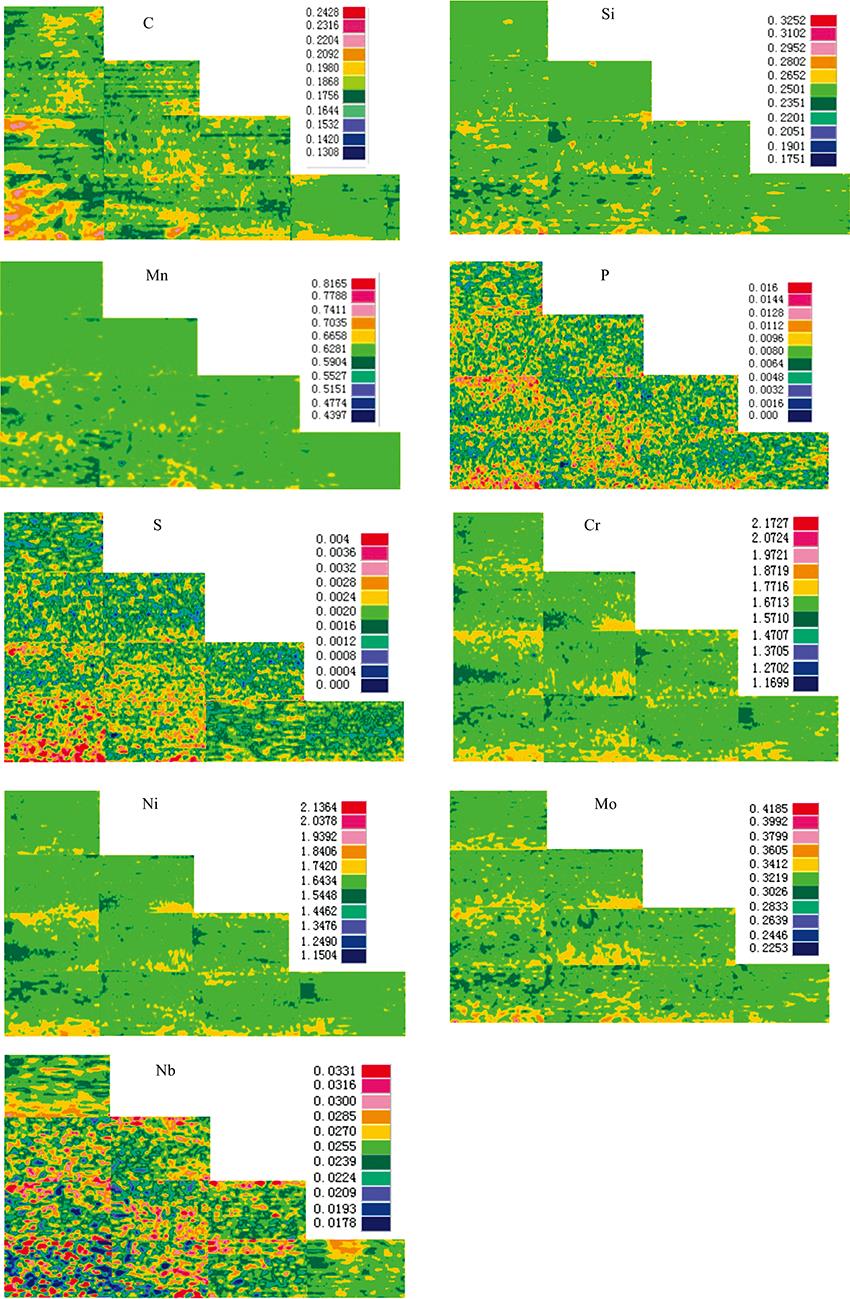
    Fig. 2. Overall distribution of each element
    样号12345678910
    C0.1870.1830.1920.1900.1840.1930.1910.1860.1830.183
    Si0.2510.2480.2540.2530.2510.2550.2540.2500.2500.250
    Mn0.6350.6280.6400.6400.6350.6420.6420.6340.6320.631
    P0.008 20.008 00.008 50.008 70.008 20.008 80.008 70.008 30.008 20.007 9
    S0.001 70.001 70.001 90.001 90.001 70.001 90.001 90.001 70.001 80.001 7
    Cr1.6751.6721.6771.6811.6751.6821.6811.6731.6721.670
    Ni1.6361.6261.6451.6431.6301.6451.6461.6301.6251.622
    Mo0.3240.3210.3270.3280.3250.3280.3280.3240.3230.322
    Nb0.0250.0240.0260.0260.0250.0260.0260.0260.0250.025
    Table 1. Average content of each sample by OPA (%)
    样号12345678910
    C94.8896.5591.1793.4397.3286.1388.9696.9598.9099.12
    Si95.3499.2990.8691.6598.5289.1490.2498.1098.9199.52
    Mn98.8299.6197.9398.6099.9890.8495.6699.5399.9999.99
    P82.9883.5080.5881.5685.2473.4378.4683.9286.7389.22
    S85.2586.5980.9484.5987.0174.1982.2885.8693.1291.82
    Cr96.0296.4894.9395.4899.1591.4993.9698.9999.7899.65
    Ni96.1496.8394.3095.0598.4288.0592.5898.4098.6599.26
    Mo96.4897.1194.4096.0298.4889.6695.2397.9299.7199.04
    Nb84.6585.5982.1383.9587.9277.4680.2586.3490.5693.76
    Table 2. Statistic conformity (%) results of each sample
    样号12345678910
    C0.078 40.076 20.083 70.081 40.065 60.109 70.089 60.073 50.054 10.052 5
    Si0.041 00.028 10.052 30.045 60.033 20.060 10.054 60.034 70.031 40.027 6
    Mn0.029 40.024 30.039 00.035 10.023 80.056 70.044 10.025 20.020 10.020 7
    P0.526 70.516 90.547 80.532 30.503 60.651 60.563 50.509 40.500 20.466 2
    S0.603 70.548 20.712 60.638 40.523 80.785 20.684 70.575 30.354 70.479 4
    Cr0.050 30.047 00.056 30.052 10.036 30.061 20.059 80.041 20.033 20.035 4
    Ni0.048 30.041 70.055 80.053 20.037 10.060 90.058 50.039 60.035 00.033 6
    Mo0.054 80.050 60.065 30.058 80.047 20.078 30.061 90.050 10.039 30.043 3
    Nb0.180 30.167 60.264 80.190 70.146 30.407 10.284 70.153 60.136 90.109 0
    Table 3. Statistic segregation results of each sample
    样号12345678910
    C1.080.922.991.510.765.413.370.840.650.59
    Si0.960.631.301.210.792.832.320.900.690.54
    Mn0.870.661.130.920.623.252.270.710.520.58
    P7.686.948.858.245.8724.0410.676.864.144.05
    S10.068.2715.1311.846.6223.7413.559.424.845.12
    Cr0.750.670.920.860.491.831.080.580.290.35
    Ni0.880.791.120.960.682.461.520.750.520.41
    Mo1.260.822.831.580.684.381.960.760.490.58
    Nb5.674.229.437.743.1423.0610.913.422.892.57
    Table 4. Results of relative standard deviation (%) of each sample
    Hui WANG, Cheng JIN, Lei ZHAO, Lei YU, Fei LIN, Xiao-fei SUN, Yun-hai JIA. Original Position Statistic Distribution Analysis of Continuous Casting Round Billet of 18CrNiMo7-6 Low and Middle Alloy Steel[J]. Spectroscopy and Spectral Analysis, 2020, 40(12): 3906
    Download Citation